Mobile Advertising Market Size, Share, Growth, Trends, and Forecast 2032

Mobile Advertising Market By Format (Search, Native Social, Display, Video, In-App, Websites, and SMS), By Organization Size (SMEs and Large Enterprises), By Category (Arts & Entertainment, Hobbies & Interests, Society, Science, Style & Fashion, Technology & Computing, and Others), By End-Use (Retail, Media & Entertainment, Travel & Tourism, Automotive, Healthcare, IT & Telecom, BFSI, and Others), and By Region - Global and Regional Industry Overview, Comprehensive Analysis, Historical Data, and Forecasts 2024-2032
| Market Size in 2023 | Market Forecast in 2032 | CAGR (in %) | Base Year |
|---|---|---|---|
| USD 174.28 Billion | USD 427.37 Billion | 10.48% | 2023 |
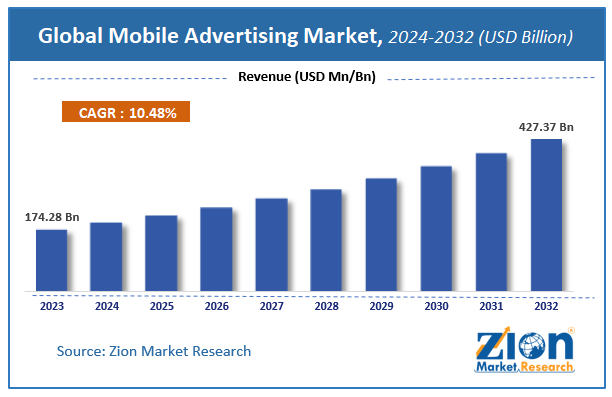
Mobile Advertising Market Size
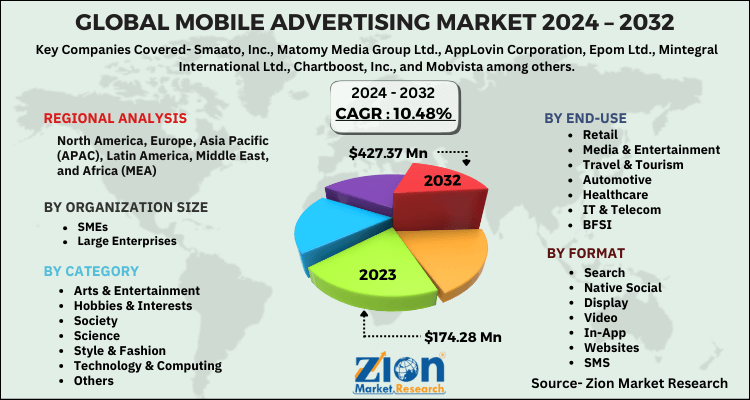
According to a report from Zion Market Research, the global Mobile Advertising Market was valued at USD 174.28 Billion in 2023 and is projected to hit USD 427.37 Billion by 2032, with a compound annual growth rate (CAGR) of 10.48% during the forecast period 2024-2032.
This report explores market strengths, weakness, opportunities, and threats. It also provides valuable insights into the market's growth drivers, challenges, and the future prospects that may emerge in the Mobile Advertising Market industry over the next decade.
Mobile Advertising Market: Overview
Mobile advertising is a method of advertising that displays advertisements on mobile devices such as smartphones, tablets or personal digital assistants (PDAs) that have wireless connections. Advertising can take place as text ads via SMS or banner advertisements that appear embedded in mobile websites in downloaded apps or in mobile games. For instance, companies such as Google, Inc. and Facebook, Inc. use mobile advertising technology in their applications and websites. Mobile advertisements are based on individual's web browsing history, geographic location, and the data collected by shopping habits. As mobile devices typically have smaller screens than computers or laptops, this form of digital advertising is usually optimized for small displays by being concise.
The mobile advertising market plays a very important role in the consumer goods and retail industry. The mobile advertising market is driven by many drivers; upsurge in mobile device penetration is one of the major drivers which drive the growth of the mobile advertising market. Apart from the mobile device penetration, the market has various drivers which drive the growth, strategies, market positioning and their various recent developments. However, the rise in privacy and security concerns is one of the major factors restraining the growth of mobile advertising market. Special mobile advertising content for low mobile connectivity areas is one potential opportunity for the market players in this market.
Mobile Advertising Market: Growth Factors
Technology has given customers a wide range of options. Nowadays, people are spending more time on tablets, smartphones, and other devices rather than sitting in front of the TV. This is due to the costs and ease of these devices, also the availability of wireless in every vertical has changed life completely. Hence, companies are now focusing more on mobile advertising as the chances of customers seeing the ad is more on digital platforms rather than the traditional form of advertising.
Additionally, the introduction of AI (Artificial Intelligence) and AR (Augmented Reality) in retail to understand customer behavior is expected to significantly drive the growth. An increase in viewers' access to OTT (Over The Top) platforms is expected to create more opportunities for market players to advertise their products online.
Mobile Advertising Market: Segmentation
Organization Size Segment Analysis Preview
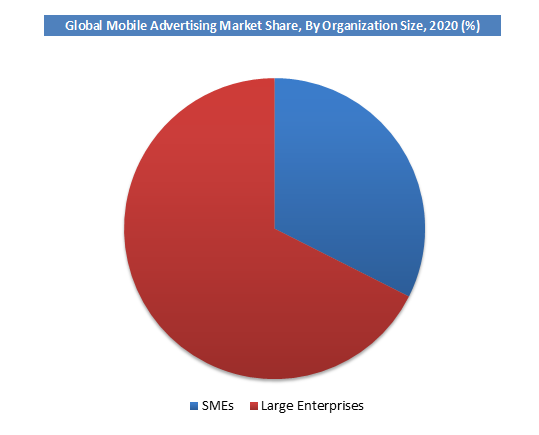
SMEs held a share of over 25% in 2020. Small and medium enterprises in every vertical and region are taking benefit of the existing mobile technology. SMEs have started creating their presence online through websites and mobile applications, which makes mobile advertising one of the most economical and effective marketing channels for them. SMS Marketing is a cost-effective advertising channel available and is being widely used in this segment. Location-based advertising is another chance for SMEs to reach their target audience at the right place and right time. SMEs are now shifting to digital marketing and a majority of their marketing expenses now go to digital marketing channels.
End-Use Segment Analysis Preview
The IT & telecom segment is projected to grow at a CAGR of over 22% from 2021 to 2028. Mobile advertising solutions have been finding a way into the IT and Telecom verticals for over a decade now. Companies in the telecommunication sector are using mobile advertising as a channel to interact & communicate with customers to improve brand awareness, and customer loyalty, and generate revenue. Travel & Tourism is also adapting mobile advertising channels highly to reach the target audience. Companies are highly spending on creating content that can create an urge to visit the destinations among customers. Tourists can also be informed about restaurants, bars, and other things near them.
Mobile Advertising Market: Report Scope
| Report Attributes | Report Details |
|---|---|
| Report Name | Mobile Advertising Market |
| Market Size in 2023 | USD 174.28 Billion |
| Market Forecast in 2032 | USD 427.37 Billion |
| Growth Rate | CAGR of 10.48% |
| Number of Pages | 120 |
| Key Companies Covered | Smaato, Inc., Matomy Media Group Ltd., AppLovin Corporation, Epom Ltd., Mintegral International Ltd., Chartboost, Inc., and Mobvista among others |
| Segments Covered | By Format, By Organization Size, By Category, By End-Use and By Region |
| Regions Covered | North America, Europe, Asia Pacific (APAC), Latin America, Middle East, and Africa (MEA) |
| Base Year | 2023 |
| Historical Year | 2018 to 2022 |
| Forecast Year | 2024 - 2032 |
| Customization Scope | Avail customized purchase options to meet your exact research needs. Request For Customization |
Mobile Advertising Market: Regional Analysis
North America accounted for a share of over 30% in 2020. The region is spending on mobile ads more as compared to others owing to the presence of major companies such as Facebook, and Google, among others, which has created an opportunity for mobile advertising. The adoption of spending on the digital platform more than on TV is happening due to the presence of tech-savvy people in the country.
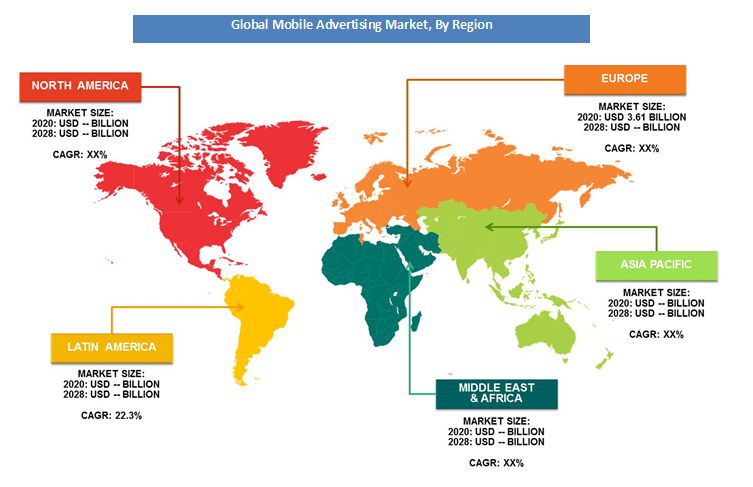
Asia Pacific is projected to grow at a CAGR of over 25% during the forecast period. Rising internet users, expansion of the smartphone market, and provision of stable telecom infrastructure would aid in driving the growth. China is considered to hold the biggest mobile devices market in this region. India would also experience a rise in growth due to the expansion of the advertising industry. Applications, such as TikTok are very popular among the crowd in this country since the crowd is more on the younger side.
Mobile Advertising Market: Key Players & Competitive Landscape
Some of the key players in the mobile advertising market are:
- Smaato Inc.
- Matomy Media Group Ltd.
- AppLovin Corporation
- Epom Ltd.
- Mintegral International Ltd.
- Chartboost Inc.
- Mobvista
- Among others
The global mobile advertising market is segmented as follows:
By Format
- Search
- Native Social
- Display
- Video
- In-App
- Websites
- SMS
By Organization Size
- SMEs
- Large Enterprises
By Category
- Arts & Entertainment
- Hobbies & Interests
- Society
- Science
- Style & Fashion
- Technology & Computing
- Others
By End-Use
- Retail
- Media & Entertainment
- Travel & Tourism
- Automotive
- Healthcare
- IT & Telecom
- BFSI
- Others
By Region
- North America
- The U.S.
- Canada
- Europe
- France
- The UK
- Spain
- Germany
- Italy
- Rest of Europe
- Asia Pacific
- China
- Japan
- India
- South Korea
- Southeast Asia
- Rest of Asia Pacific
- Latin America
- Brazil
- Mexico
- Rest of Latin America
- Middle East & Africa
- GCC
- South Africa
- Rest of The Middle East & Africa
Table Of Content
Methodology
FrequentlyAsked Questions
Mobile advertising refers to the delivery of promotional content to users through mobile devices such as smartphones and tablets. It includes formats like in-app ads, mobile web banners, video ads, and SMS marketing, leveraging mobile-specific features like location data to target audiences effectively.
According to study, the Mobile Advertising Market size was worth around USD 174.28 billion in 2023 and is predicted to grow to around USD 427.37 billion by 2032.
The CAGR value of Mobile Advertising Market is expected to be around 10.48% during 2024-2032.
North America has been leading the Mobile Advertising Market and is anticipated to continue on the dominant position in the years to come.
The Mobile Advertising Market is led by players like Smaato, Inc., Matomy Media Group Ltd., AppLovin Corporation, Epom Ltd., Mintegral International Ltd., Chartboost, Inc., and Mobvista among others.
HappyClients

