Augmented Reality Market Size, Share, Trends and Analysis 2032

Augmented Reality Market By Component (Hardware, Software), By Display (Head-mounted, Head-up, Handheld, Spatial), By Application (Aerospace & Defense, Industrial, Consumer, Commercial, E-Commerce, Retails): Global Industry Perspective, Comprehensive Analysis and Forecast, 2024-2032
| Market Size in 2023 | Market Forecast in 2032 | CAGR (in %) | Base Year |
|---|---|---|---|
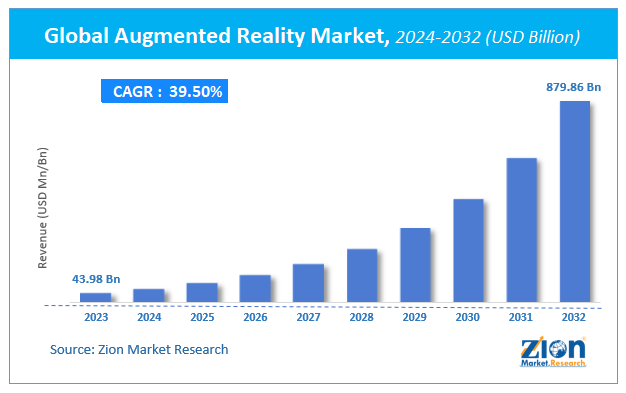
| USD 43.98 Billion | USD 879.86 Billion | 39.5% | 2023 |
Augmented Reality Market Insights
Zion Market Research has published a report on the global Augmented Reality Market, estimating its value at USD 43.98 Billion in 2023, with projections indicating that it will reach USD 879.86 Billion by 2032. The market is expected to expand at a compound annual growth rate (CAGR) of 39.5% over the forecast period 2024-2032. The report explores the factors fueling market growth, the hitches that could hamper this expansion, and the opportunities that may arise in the Augmented Reality Market industry. Additionally, it offers a detailed analysis of how these elements will affect market demand dynamics and market performance throughout the forecast period.
Augmented Reality Market: Overview
The increasing demand for remote assistance and collaboration from enterprises that assist in workflow managing and optimization is projected to drive market growth. Businesses are using Augmented Reality (AR) -based apps for identifying, tracking, and resolving technical issues also as for tasks, like retrofitting, manufacturing, assembling, and repairing production lines.
The rising preference among persons for smart glasses, smartphones, and other handheld and wearable devices is pouring the adoption of mobile AR technology to supply immersive experiences. As such, companies are particularly exploring the potential of AR technology to supply a customized and interactive experience to customers. For instance, in June 2018, Hennes & Mauritz AB’s brand Monki approved AR technology to supply a 3D experience to its clientele through smartphones while presenting garments on the web platform.
Various initiative by market players is additionally among the rationale in charge of the event of the augmented reality market. for instance, in January 2018, Google launched a replacement Google expedition, which offers AT to colleges and allows a better learning experience & understanding for scholars. Additionally, it's being employed to see 3D world landmarks, landscapes, and lots more.
The outbreak of the pandemic is probably going to inspire pharmaceutical vendors to spread their R&D investments in AI, which acts as a core technology for allowing various initiatives. The increasing adoption of digital media is one of the main factors driving the expansion of the market. The closure of faculties, colleges, and institutions for an indefinite period due to the spread of the COVID-19 outbreak has boosted the demand for online learning, as schools struggle to stay at pace with the predetermined academic calendars. On the flip side, COVID-19 has affected manufacturing operations across the world. The delays in the production of consumer electronics products like smartphones, tablets, smart glasses, and wearables, thanks to the lockdowns imposed, are hindering the expansion of the market.
Augmented Reality Market: Growth Factors
Upcoming trends like growing convergence between AR, wearable devices, and GPS is likely to spice up the need for the augmented reality market. The high penetration of smartphones and tablets is the primary reason that is prompting the approval of the augmented reality market. User Interface limitations might hinder the event of the augmented reality market. It also shows technological inefficiency in determining different physical challenges due to a lack of knowledge insight management, hindering the augmented reality market.
Augmented Reality Market: Segment Analysis Preview
The augmented reality market is split supported by the display, component, region, and application. Components comprised during this tech are software and hardware (semiconductors, display, and sensor). The hardware elements are expected to grow with a robust CAGR within the years to return. Firms like Microsoft and Sony are likely to launch their AR-based devices within the near future, which is anticipated to accentuate the competition within the augmented reality market over the years to return. Additionally, different firms are operating on improving the standard of processors and sensors, which are used in AR devices. for instance, Google has joined hands with the chip makers to create camera components and processors for Android handsets.
It is predicted to continue dominating the market over the forecast period due to the growing adoption of AR devices across various industry verticals, including healthcare, education, manufacturing, retail, and e-commerce, among others. The acceptance of AR technology is fast traction in the wake of the COVID-19 pandemic as individuals are observing forward to having an immersive and real-like experience at home.
Augmented Reality Market: Report Scope
| Report Attributes | Report Details |
|---|---|
| Report Name | Augmented Reality Market |
| Market Size in 2023 | USD 43.98 Billion |
| Market Forecast in 2032 | USD 879.86 Billion |
| Growth Rate | CAGR of 39.5% |
| Number of Pages | 120 |
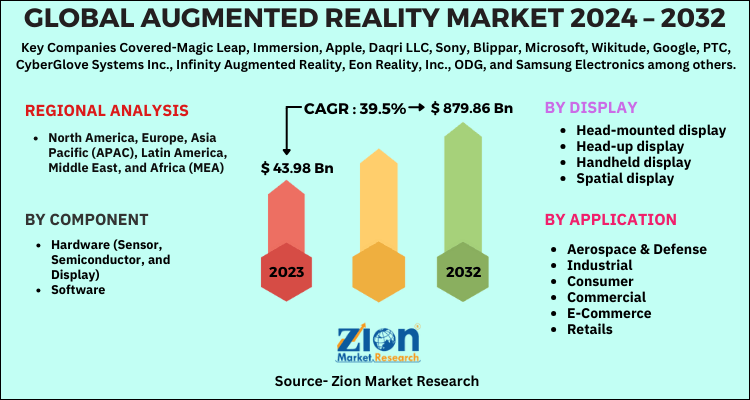
| Key Companies Covered | Magic Leap, Immersion, Apple, Daqri LLC, Sony, Blippar, Microsoft, Wikitude, Google, PTC, CyberGlove Systems Inc., Infinity Augmented Reality, Eon Reality, Inc., ODG, and Samsung Electronics among others |
| Segments Covered | By Product Type, By Application, And By Region |
| Regions Covered | North America, Europe, Asia Pacific (APAC), Latin America, Middle East, and Africa (MEA) |
| Base Year | 2023 |
| Historical Year | 2018 to 2022 |
| Forecast Year | 2024 - 2032 |
| Customization Scope | Avail customized purchase options to meet your exact research needs. Request For Customization |
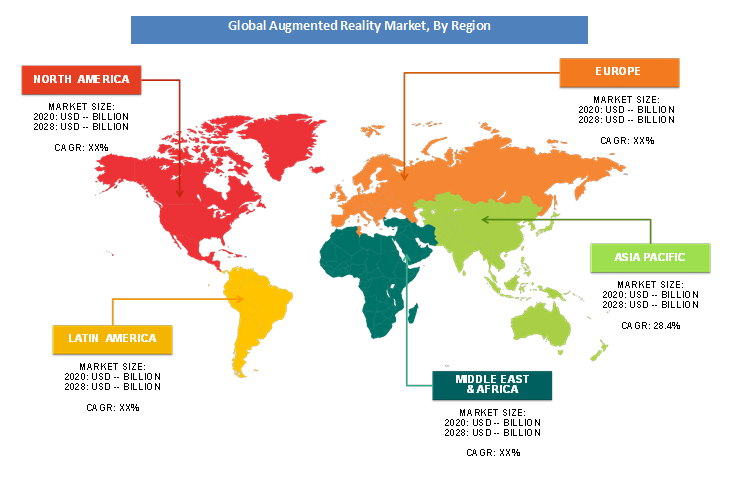
Augmented Reality Market: Regional Analysis Preview
E-commerce is becoming a serious area of focus for retailers in APAC, where China is becoming the most important e-commerce market worldwide. The high demand for AR devices and software from the commercial sector would help drive the AR market in APAC. Growing consumer and commercial markets with increasing investments in countries like Japan, India, and China would boost the expansion of the AR market in APAC.
Key Market Players & Competitive Landscape
Some of the key players in the Augmented Reality market are
- Magic Leap
- Immersion
- Apple
- Daqri LLC
- Sony
- Blippar
- Microsoft
- Wikitude
- PTC
- CyberGlove Systems Inc
- Infinity Augmented Reality
- Eon Reality, Inc
- ODG
- Samsung Electronics
Augmented Reality Market: Segmentation Landscape
By Component
- Hardware (Sensor, Semiconductor, and Display)
- Software
By Display
- Head-mounted display
- Head-up display
- Handheld display
- Spatial display
By Application
- Aerospace & Defense
- Industrial
- Consumer
- Commercial
- E-Commerce
- Retails
By Region
- North America
- The U.S.
- Canada
- Europe
- France
- The UK
- Spain
- Germany
- Italy
- Rest of Europe
- Asia Pacific
- China
- Japan
- India
- South Korea
- Southeast Asia
- Rest of Asia Pacific
- Latin America
- Brazil
- Mexico
- Rest of Latin America
- Middle East & Africa
- GCC
- South Africa
- Rest of Middle East & Africa
Table Of Content
Methodology
FrequentlyAsked Questions
Zion Market Research has published a report on the Global Augmented Reality Market, estimating its value at USD 43.98 Billion in 2023, with projections indicating that it will reach USD 879.86 Billion by 2032.
The market is expected to expand at a compound annual growth rate (CAGR) of 39.5% over the forecast period 2024-2032.
Some of the key factors driving the Global Augmented Reality market growth are the adavancement of technology, increasing digitalization and rising health awareness among individuals.
Asia Pacific region held a substantial share of the Augmented Reality market in 2020. The high demand for AR devices and software from the commercial sector would help drive the AR market in APAC.
Some of the major companies operating in the Augmented Reality market are Magic Leap, Immersion, Apple, Daqri LLC, Sony, Blippar, Microsoft, Wikitude, Google, PTC, CyberGlove Systems Inc., Infinity Augmented Reality, Eon Reality, Inc., ODG, and Samsung Electronics among others.
HappyClients

