Personal Care Ingredients Market Size, Share, Analysis, Trends, Growth, 2032

Personal Care Ingredients Market By Ingredient Type (Emollients, Surfactants, Emulsifiers, Rheology Modifiers, Conditioning Polymers, and Others), By Application (Skin Care, Hair Care, Oral Care, and Others): Global Industry Perspective, Comprehensive Analysis and Forecast, 2024 - 2032
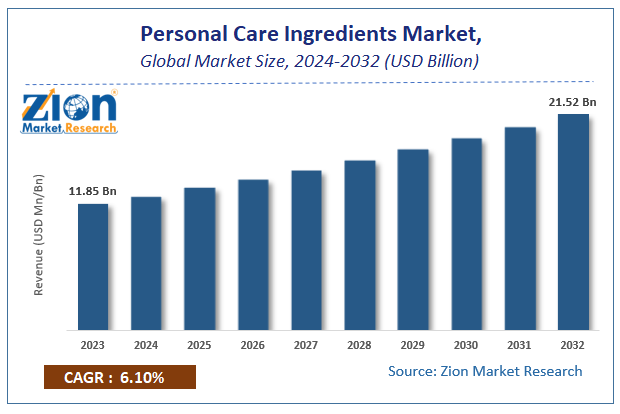
| Market Size in 2023 | Market Forecast in 2032 | CAGR (in %) | Base Year |
|---|---|---|---|
| USD 11.85 Billion | USD 21.52 Billion | 6.1% | 2023 |
Personal Care Ingredients Market Insights
According to Zion Market Research, the global Personal Care Ingredients Market was worth USD 11.85 Billion in 2023. The market is forecast to reach USD 21.52 Billion by 2032, growing at a compound annual growth rate (CAGR) of 6.1% during the forecast period 2024-2032. The report offers a comprehensive analysis of the market, highlighting the factors that will determine growth, potential challenges, and opportunities that could emerge in the Personal Care Ingredients Market industry over the next decade.
Global Personal Care Ingredients Market: Overview
Personal care is the personal as well as private hygiene and toileting of an individual which may include care for different body parts. Personal care ingredients are the raw materials that are used for the making of these personal care products. These may range from natural and bio-based ingredients to chemical ingredients. However, in recent years it has been observed that consumers are shifting to more natural-based ingredients.
Global Personal Care Ingredients Market: COVID-19 Impact Analysis
COVID-19 pandemic had a mixed impact on the personal care ingredients market. Due to the lockdown all the various operations, distribution and manufacturing of the sector were impacted globally. There was also a decrease in demand for a particular part of personal care. However, due to the increased awareness of sanitization and hygiene, there was a huge demand for sanitizer, soap, disinfectants, & others. This added revenue to the personal care ingredients market.
Global Personal Care Ingredients Market: Growth Factors
There are various factors leading to the growth of the personal care ingredients market. Increased purchasing power of the consumers along with the improved standard of living which is expected to grow over the coming years will facilitate the overall growth of the personal care ingredients market. Also, increased customer awareness about personal care and its benefits will contribute to the market. As the pandemic continues, there will be extensive emphasis on sanitization and hygiene which will drive the growth of the personal care ingredients market.
Personal Care Ingredients Market: Report Scope
| Report Attributes | Report Details |
|---|---|
| Report Name | Personal Care Ingredients Market |
| Market Size in 2023 | USD 11.85 Billion |
| Market Forecast in 2032 | USD 21.52 Billion |
| Growth Rate | CAGR of 6.1% |
| Number of Pages | 140 |
| Key Companies Covered | Ashland Global Holdings Inc., BASF SE, Berkshire Hathaway Inc., Clariant AG, Croda International Plc., DOW, Inc., Evonik Industries AG, J.M. Huber Corporation, KCC Corporation, and Solvay S.A, among others |
| Segments Covered | By Ingredient Type, By Application and By Region |
| Regions Covered | North America, Europe, Asia Pacific (APAC), Latin America, Middle East, and Africa (MEA) |
| Base Year | 2023 |
| Historical Year | 2018 to 2022 |
| Forecast Year | 2024 - 2032 |
| Customization Scope | Avail customized purchase options to meet your exact research needs. Request For Customization |
Ingredient Type Segment Analysis Preview
There are different ingredient types which are used for the market. The surfactants segment took the highest market share among others. This may be due to the increase in demand of the anti-ageing products within the growing middle- age population. Emollients, emulsifiers, rheology modifiers, conditioning polymers, and others form the ingredient type segment.
Application Segment Analysis Preview
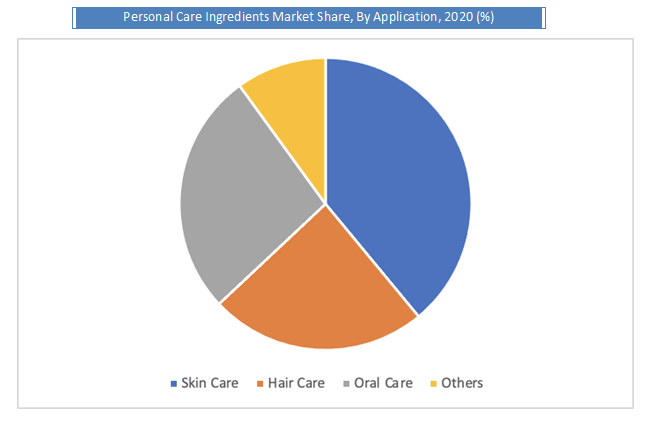
The Skin Care segment held a share of over 14.94% in 2020. There are various areas where personal care ingredients may be applied directly or indirectly. Skin care sector occupied the highest market share. This may be due to the growing population and the increase in awareness of products such as sun care products, body lotions, facial creams, and others by consumers globally. Hair Care, oral Care, and others form the application segment.
Regional Analysis Preview
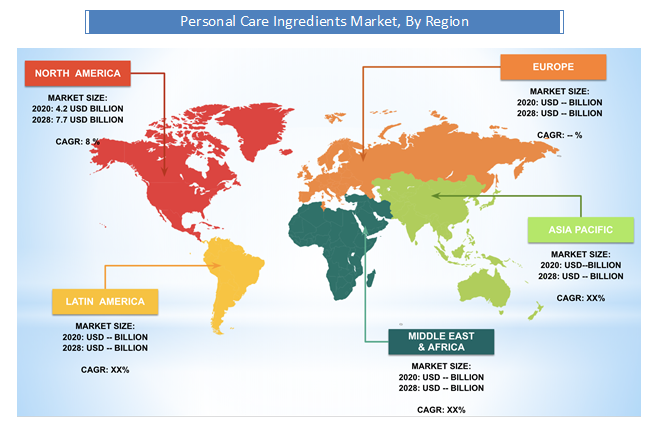
The North America region is projected to grow at a CAGR of 8 % over the forecast period. North America dominates the personal care ingredients market. The increased awareness of the personal care and hygiene among the population contributes to the dominance of the region in the personal care ingredients market. High disposable income of the population increases the spending capacity of the region and drives the growth of the personal care ingredients market.
Europe’s contribution towards the personal care ingredients market is also expected to be growing significantly over the coming years. This may be due to the increasing demand of the personal care ingredients for different luxury products ranging from skin care to hair care and many more. There is also a demand for natural cosmetics with good quality which will also contribute towards the growth of the market in the region.
Global Personal Care Ingredients Market: Competitive Landscape
Some of the key players in the personal care ingredients market are
- Ashland Global Holdings Inc.
- BASF SE
- Berkshire Hathaway Inc.
- Clariant AG
- Croda International Plc.
- DOW Inc.
- Evonik Industries AG
- J.M. Huber Corporation
- KCC Corporation
- Solvay S.A
- among others.
These companies adopt various strategies in order to boost their presence and capitalization. For instance, BASF SE is jointly developing profitable, innovative and sustainable solutions for global challenges in order to gain competitive advantage in the market.
The Personal Care Ingredients Market is segmented as follows:
By Ingredient Type
- Emollients
- Surfactants
- Emulsifiers
- Rheology Modifiers
- Conditioning Polymers
- Others
By Application
- Skin Care
- Hair Care
- Oral Care
- Others
By Region
- North America
- The U.S.
- Canada
- Europe
- France
- The UK
- Spain
- Germany
- Italy
- Rest of Europe
- Asia Pacific
- China
- Japan
- India
- South Korea
- Southeast Asia
- Rest of Asia Pacific
- Latin America
- Brazil
- Mexico
- Rest of Latin America
- Middle East & Africa
- GCC
- South Africa
- Rest of Middle East & Africa
Table Of Content
Methodology
FrequentlyAsked Questions
The personal care ingredients market was valued at 11.85 USD Billion in 2023.
The personal care ingredients market is expected to reach USD 21.52 Billion by 2032, growing at a CAGR of 6.1% from 2024 to 2032.
Some of the key factors driving the personal care ingredients market growth are, increased purchasing power of the consumers along with the improved standard of living which is expected to grow over the coming years will facilitate the overall growth of the personal care ingredients market.
The North America region held a substantial share of the XX market in 2020. The increased awareness of the personal care and hygiene among the population and high disposable income contributes to the dominance of the region in the personal care ingredients market.
Some of the major companies operating in the personal care ingredients market are Ashland Global Holdings Inc., BASF SE, Berkshire Hathaway Inc., Clariant AG, Croda International Plc., DOW, Inc., Evonik Industries AG, J.M. Huber Corporation, KCC Corporation, and Solvay S.A, , among others.
HappyClients

