Micro Computed Tomography Market Size, Share, and Forecast 2032

Micro Computed Tomography Market - By Product (In-Vivo and Ex-Vivo), By Application (Life Science, Dentistry, Plants & Food, and Bones), And By Region- Global Industry Perspective, Comprehensive Analysis, and Forecast, 2024 - 2032-
| Market Size in 2023 | Market Forecast in 2032 | CAGR (in %) | Base Year |
|---|---|---|---|
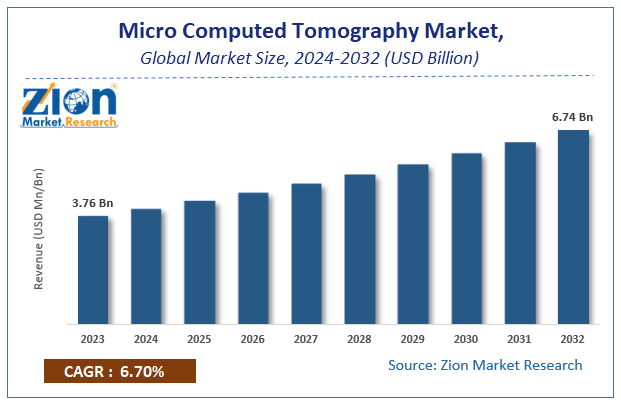
| USD 3.76 Billion | USD 6.74 Billion | 6.7% | 2023 |
Micro Computed Tomography Market Size
According to Zion Market Research, the global Micro Computed Tomography Market was worth USD 3.76 Billion in 2023. The market is forecast to reach USD 6.74 Billion by 2032, growing at a compound annual growth rate (CAGR) of 6.7% during the forecast period 2024-2032.
The report offers a comprehensive analysis of the market, highlighting the factors that will determine growth, potential challenges, and opportunities that could emerge in the Micro Computed Tomography Market industry over the next decade.
Micro Computed Tomography Market: Overview
Micro Computed tomography is an imaging technique enabling the production of high-resolution 3D pictures. Apparently, microcomputed device is made up of x-ray tube, charge-coupled devicecamera, collimator, specimen stand, and radiation filter. Inaddition to this, micro-computed tomography possesses outstandingspace resolution and reduced capture time in comparison to conebeam computed tomography. Furthermore, when micro CT is used alongwith highly developed image reconstruction system, it will becomepossible for performing imaging examinations in lab animals & otherpet animals. Moreover, micro CT technique can also help inimage-based evaluation of health conditions in pet animals such ascats & dogs.
In addition to this, Micro CT is a key tool for monitoring bone structure as well as its quality. Apparently, it has also been usedfor studying metabolic bone disorders such as osteoporosis alongwith evaluating its preclinical tests and checking efficiency ofanabolic therapeutics such as bisphosphonates. Micro CT can alsoevaluate fragility of bones caused as a result of aging &osteoporosis. Furthermore, Micro Computed Tomography has the ability of discerning small & large blood vessels with high resolution 3Dimages.
Micro Computed Tomography Market: GrowthDrivers
Micro Computed tomography is utilized in root canal preparationas well as in dental diagnosis and helps in effectively treatingoral diseases in both pet animals & human beings, thereby drivingmarket trends. The rise in bioengineering & biological applications of micro CT will steer the expansion of the micro-computed tomography industry for years to come. Large-scale use of micro-computed tomography in tissue engineering, vascular imaging, and contrast-enhanced cartilage imaging is likely to enlarge industry scope. Growingnecessity of tomographic imaging of human & small animal organbiopsies will boost expansion of micro computed tomography industryin years ahead. Apparently, lab x-ray micro computed tomographyfinds wide applications in scientific & medical research,particularly, in non-destructive imaging of morphologicalstructures.
Micro Computed Tomography Market: Report Scope
| Report Attributes | Report Details |
|---|---|
| Report Name | Micro Computed Tomography Market |
| Market Size in 2023 | USD 3.76 Billion |
| Market Forecast in 2032 | USD 6.74 Billion |
| Growth Rate | CAGR of 6.7% |
| Number of Pages | 150 |
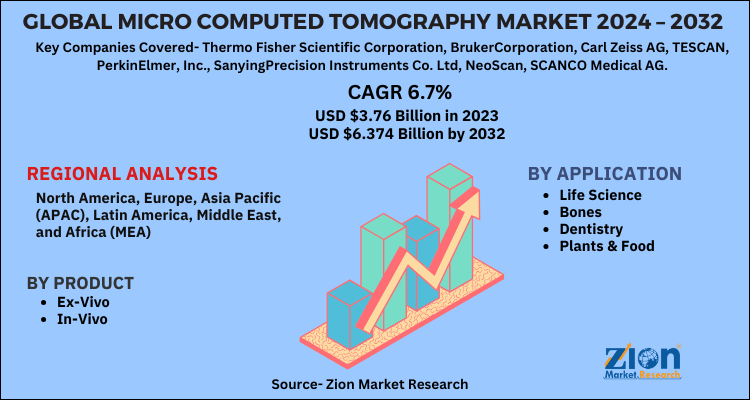
| Key Companies Covered | Thermo Fisher Scientific Corporation, BrukerCorporation, Carl Zeiss AG, TESCAN, PerkinElmer, Inc., SanyingPrecision Instruments Co. Ltd, NeoScan, SCANCO Medical AG, and north Star Imaging Inc |
| Segments Covered | By Product, By Application, By End-Use,and By Region |
| Regions Covered | North America, Europe, Asia Pacific (APAC), Latin America, Middle East, and Africa (MEA) |
| Base Year | 2023 |
| Historical Year | 2018 to 2022 |
| Forecast Year | 2024 - 2032 |
| Customization Scope | Avail customized purchase options to meet your exact research needs. Request For Customization |
Furthermore, Micro CT is also utilized in intraoperative imagingof breast cancer specimens. Moreover, it offers image rotation,slicing of breast specimens, and quantitative imaging parameters. All these aspects will spike growth of micro computed tomographymarket.
Micro Computed Tomography Market: Regional Analysis
North America To Contribute Majorly Towards OverallMarket Share By 2032
Expansion of micro computed tomography market in North Americaover assessment period is subject to rise in technologicalbreakthroughs in imaging techniques. Apart from this, new druglaunches and breakthroughs in drug discovery methods, cancermonitoring processes, phenotype recognition, and disease patternrecognition techniques has paved way for growth of micro computedtomography market in region. Rise in cases of COVID-19 in countriessuch as the U.S. has prompted demand for Micro Computed Tomography. Huge government spending on healthcare activities in countries suchas Canada and the U.S. will exponentiate size of micro computedtomography market in North American region.
Micro Computed Tomography Market: Competitive Landscape
Key players profiled in report and majorly influencing market value include:
- Thermo Fisher Scientific Corporation
- BrukerCorporation
- Carl Zeiss AG
- TESCAN
- PerkinElmer Inc.
- SanyingPrecision Instruments Co. Ltd
- NeoScan
- SCANCO Medical AG
- North Star Imaging Inc.
The global Micro Computed Tomography Market is segmented as follows:
By Product
- Ex-Vivo
- In-Vivo
By Application
- Life Science
- Bones
- Dentistry
- Plants & Food
By Region
- North America
- The U.S.
- Canada
- Europe
- France
- The UK
- Spain
- Germany
- Italy
- Rest of Europe
- Asia Pacific
- China
- Japan
- India
- South Korea
- Southeast Asia
- Rest of Asia Pacific
- Latin America
- Brazil
- Mexico
- Rest of Latin America
- Middle East & Africa
- GCC
- South Africa
- Rest of Middle East & Africa
Table Of Content
Methodology
FrequentlyAsked Questions
HappyClients

