AR in Enterprise Market Trend, Share, Growth, Size, Analysis and Forecast 2032

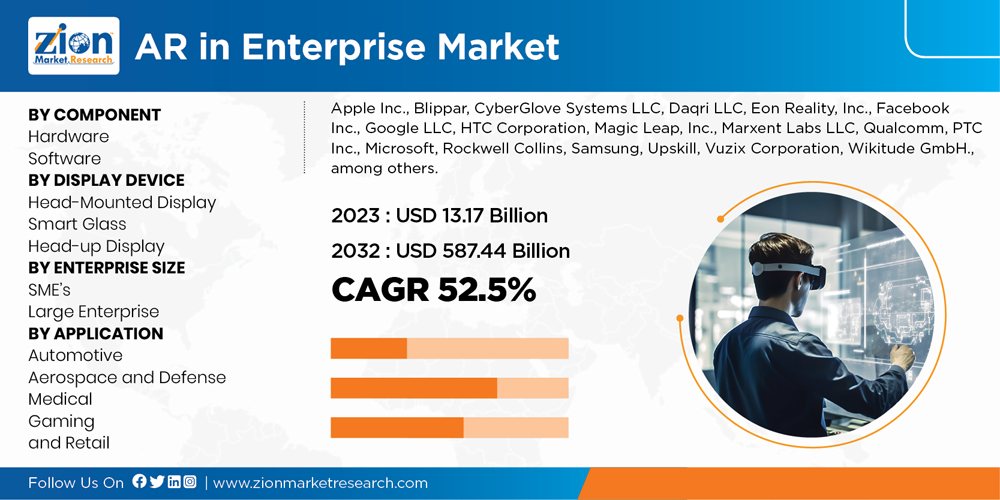
AR in Enterprise Market Analysis by Component (Hardware and Software); by Display Device (Head-Mounted Display, Smart Glass, and Head-up Display); by Enterprise Size (SME’s and Large Enterprise); by Application (Automotive, Aerospace and Defense, Medical, Gaming, and Retail), and By Region - Global Industry Analysis, Size, Share, Growth, Trends, and Forecast 2024-2032
| Market Size in 2023 | Market Forecast in 2032 | CAGR (in %) | Base Year |
|---|---|---|---|
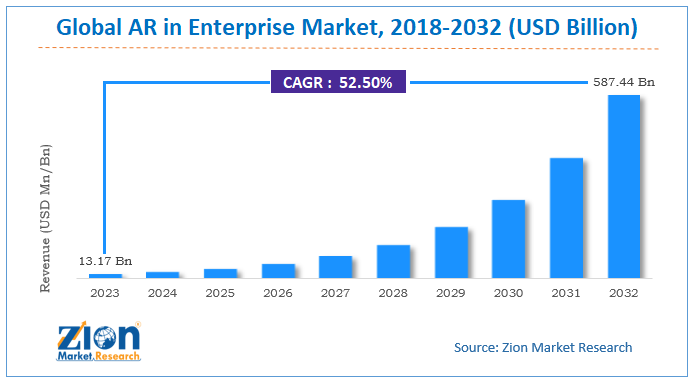
| USD 13.17 Billion | USD 587.44 Billion | 52.5% | 2023 |
AR in Enterprise Market Overview
Augmented reality is a technology makes use of virtual reality and the real world. The technology enriches the real world experience by making use of the media and the digital information such as 3D images, videos, and models. While comparing virtual reality with augmented reality technology, virtual reality provides a completely artificial environment while augmented reality makes use of the real-time environment and adds new digital enhancements in it.
AR in Enterprise Market: Industry Perspective
The global AR in Enterprise market size accrued earnings worth approximately USD 13.17 Billion in 2023 and is predicted to gain revenue of about USD 587.44 Billion by 2032, is set to record a CAGR of nearly 52.5% over the period from 2024 to 2032.
 Request Free SampleRequest Free Sample
AR in Enterprise Market: Drivers and Restraints
The major factor driving the growth of AR in enterprise market is the increasing demand for the technology from various industries such as medical, retail, aerospace, and defense, etc. The AR technology in the healthcare sector is proving beneficial in saving lives and in making the existing procedures efficient and precise. In the education sector, augmented reality has improved the way of learning and training. Increased benefits of the augmented reality technology are driving the market positively.
Moreover, increasing investment in augmented reality market by the key players in the industry is expected to propel the growth of AR in enterprise market globally. The high-resolution pictures and real-time imaging provided by AR improves the consumer experience, hence the demand for AR is increasing in the retail sector globally.
However, for installing the software and software updates strong and large storage system is required. The less storage and restricted size of the memory card in mobile phone limits the adoption of the augmented reality apps. Other factors limiting the growth of the market are the high cost of the software and devices and lack of knowledge about the technology.
 Request Free SampleRequest Free Sample
AR in Enterprise Market: Report Scope
| Report Attributes | Report Details |
|---|---|
| Report Name | AR in Enterprise Market |
| Market Size in 2023 | USD 13.17 Billion |
| Market Forecast in 2032 | USD 587.44 Billion |
| Growth Rate | CAGR of 52.5% |
| Number of Pages | 204 |
| Key Companies Covered |
Apple Inc., Blippar, CyberGlove Systems LLC, Daqri LLC, Eon Reality, Inc., Facebook Inc., Google LLC, HTC Corporation, Magic Leap, Inc., Marxent Labs LLC, Qualcomm, PTC Inc., Microsoft, Rockwell Collins, Samsung, Upskill, Vuzix Corporation, Wikitude GmbH., among others. |
| Segments Covered | By Component, By Display Device, By Enterprise Size, By Application, and By Region |
| Regions Covered | North America, Europe, Asia Pacific (APAC), Latin America, Middle East, and Africa (MEA) |
| Base Year | 2023 |
| Historical Year | 2018 to 2022 |
| Forecast Year | 2024 - 2032 |
| Customization Scope | Avail customized purchase options to meet your exact research needs. Request For Customization |
AR in Enterprise Market Segmentation
Software and hardware are two essential components of AR in enterprise solutions. Key hardware components used in augmented reality technology includes cameras, sensors, semiconductors, position trackers, projection display, etc. Whereas, the software components include software development kits, software functions, and cloud-based services. On the basis of the component, the hardware segment accounted for the major market share in the global AR in enterprise market. In 2023, more than 70% of market share was contributed by the hardware segment. For the utilization of augmented reality applications terminal devices with intense hardware, modules are very vital. The key functions such as visibility and operating effects depend on the quality of hardware. Thus the rising demand for the technically advanced and easy to operate hardware for augmented reality is expected to propel the growth of hardware segment over the forecast period.
A head-mounted display, heads-up display, and smart glass are the three major types of displays used in AR in enterprise market. The head-mounted display segment is expected to register the highest CAGR growth. The head-mounted display is one of the basic components in the headsets. It offers advanced vision along with high-resolution 3D images and viewing. The rising adoption of a head-mounted display in augmented reality and decreasing cost of HMDs are factors propelling the growth of this segment in the global market in the coming years. Moreover, the demand for the AR-based heads-up display is also increasing in the aviation and automotive industry thus propelling the growth of the heads-up display segment in the coming years.
The AR technology is being highly adopted by the large enterprises. Owing to the need for the high investments in the technology currently large enterprises are contributing the major share in the global market. Large enterprises invest in advanced technologies in order to increase their output. By making use of AR technology they train their employees and also enhance their customer experiences. In 2023, a major market share of over 60% was contributed by the large enterprises. However, it is anticipated that in the forecast period small and mid-sized enterprises will also be highly embracing this technology owing to its benefits.
Augmented reality technology is being highly used in several sectors such as healthcare, retail, automotive, gaming, etc. Among these, the automotive sector accounted for the major market share of over 67% in 2023. It is anticipated that this dominance will be retained during the forecast period. In the coming years, there will be an increased adoption of the AR technology in enhancing the driver’s experience. Information will be displayed to the drivers via the windscreens with the help of AR technology. AR technology will help in visualizing the general design and the body structure of the vehicle thus benefitting in the manufacturing process. Owing to these increased benefits of AR technology in the automotive sector its popularity will increase in the coming years.
AR in Enterprise Market: Regional Analysis
North America is leading in the global AR in enterprise market with a huge market share of over 59% in 2023. The early and the increased adoption of the advanced technologies is the key factor driving the growth of the market in this region. Followed by North America, Europe also holds a significant share in the global AR in enterprise market. Increasing adoption of the augmented reality technology in the automotive sector contributed to the growth of the market in Europe. The strong display manufacturers present in the emerging nations such as China and Japan are contributing to the growth of the AR in enterprise market in the Asia Pacific.
Industry Players
The report includes detailed profiles of the prominent market players that are trending in the market. The list of the players that are compiled in the report areas
- Apple Inc.
- Blippar
- CyberGlove Systems LLC
- Daqri LLC
- Eon Reality, Inc.
- Facebook Inc.
- Google LLC
- HTC Corporation
- Magic Leap, Inc.
- Marxent Labs LLC
- Qualcomm
- PTC Inc.
- Microsoft
- Rockwell Collins
- Samsung
- Upskill
- Vuzix Corporation
- Wikitude GmbH., among others.
The increasing product launch, growing strategic collaboration, and partnership among the top players of the AR in enterprise market is significantly contributing towards the growth of the market globally. For instance, the Apple had acquired augmented reality headset startup Vrvana. The acquisition of Vrvana is expected to significantly contribute to the new product development for AR in enterprise.
By Component
- Hardware
- Software
By Display Device
- Head-Mounted Display
- Smart Glass
- Head-up Display
By Enterprise Size
- SME’s
- Large Enterprise
By Application
- Automotive
- Aerospace and Defense
- Medical
- Gaming
- and Retail
By Region
- North America
- The U.S.
- Canada
- Europe
- France
- The UK
- Spain
- Germany
- Italy
- Rest of Europe
- Asia Pacific
- China
- Japan
- India
- South Korea
- Southeast Asia
- Rest of Asia Pacific
- Latin America
- Brazil
- Mexico
- Rest of Latin America
- Middle East & Africa
- GCC
- South Africa
- Rest of Middle East & Africa
Table Of Content
Methodology
FrequentlyAsked Questions
HappyClients

