U.S. Chocolate Beverage Powder Market Size, Share, Trends, Growth and Forecast2032

U.S. Chocolate Beverage Powder Market By Type (Milk Chocolate Powder, Dark Chocolate Powder, White Chocolate Powder), By Packaging Format (Metal Containers, Plastic Containers, Cartons, Pouches, Others), By Distribution Channel (Hypermarkets/Supermarkets, Food and Drug mass, Clubs, E-Commerce, Specialty, Global Travel Retail), and By Packaging Size (Up to 500 Grams, 501-1,000 Grams, 1,000-1,500 Grams, More than 1,500 Grams):U.S. Industry Perspective, Comprehensive Analysis and Forecast, 2024 - 2032
| Market Size in 2023 | Market Forecast in 2032 | CAGR (in %) | Base Year |
|---|---|---|---|
| USD 3.18 Billion | USD 5.92 Billion | 6.4% | 2023 |
U.S. Chocolate Beverage Powder Market Insights
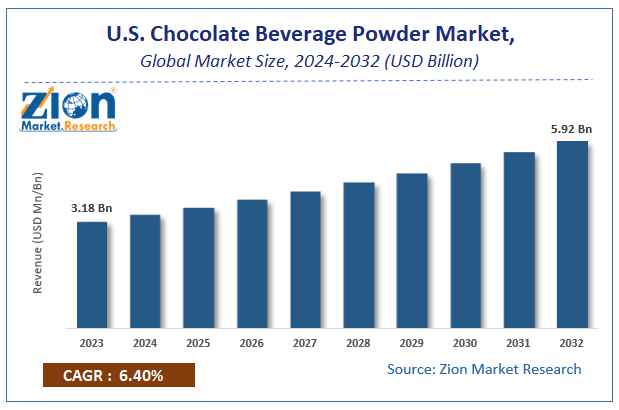
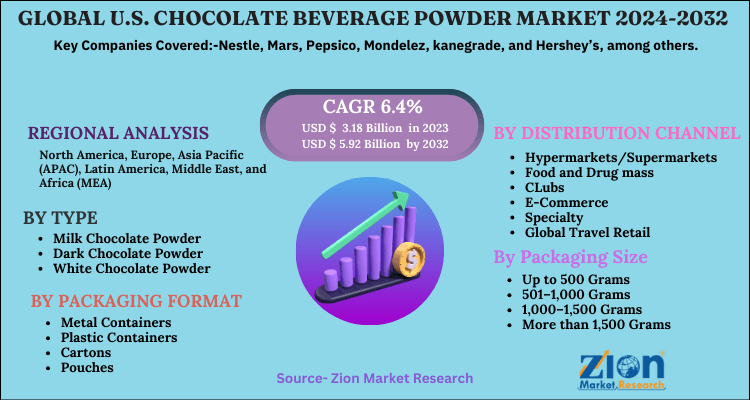
Zion Market Research has published a report on the global U.S. Chocolate Beverage Powder Market, estimating its value at USD 3.18 Billion in 2023, with projections indicating that it will reach USD 5.92 Billion by 2032. The market is expected to expand at a compound annual growth rate (CAGR) of 6.4% over the forecast period 2024-2032.
The report explores the factors fueling market growth, the hitches that could hamper this expansion, and the opportunities that may arise in the U.S. Chocolate Beverage Powder Market industry. Additionally, it offers a detailed analysis of how these elements will affect market demand dynamics and market performance throughout the forecast period.
 Request Free SampleRequest Free Sample
Market Overview
According to the data from various sources, such as bars, cafes, and convenience stores, there has been a significant rise in the purchasers of the products. The reason for this is that these products contain high content of caffeine and sugar that can affect the body positively. It gives more energy to improve mental focus and endurance during exercise activities that require physical effort. In addition, drinking powdered drinks with cacao will help satisfy hunger by giving a slow release of carbohydrates into the blood system. This will make the stomach feel full longer, especially in adolescents who are often busy with various activities after school.
COVID-19 Impact Analysis
The covid-19 pandemic has affected almost all sectors across the globe. However, the chocolate beverage powder market remains unaffected during this period. On top of that several leading market players in the region reported improvement in revenue as people were found to be stockpiling their favorite food, especially premium chocolate powder. Since they are staying at home for a longer time and spending less time outside, they have started consuming more comfort food. For instance, it has been found that 51% of people are preferring chocolate as their comfort food and the remaining 49% are considering it as their favorite food.
 Request Free SampleRequest Free Sample
Growth Factors
Teens, young adults, and even children are concerned about their weight and overall health. This has led them to make healthier choices of food and drinks they consume on a daily basis. Obesity is a serious issue around the world. A huge part of healthier beverage demand is driven by the functional benefits drinks can provide to consumers. Functional benefits refer to "cues that something possesses beneficial physiological effects. These cues that manufacturers place on packaging or advertisements regarding what a product can do for consumers' health typically influence consumer preferences. For instance, calcium content is linked with healthy, which could be advertised as one of Citrus's benefits. It would be wise to include this on the packaging, or in advertisements. Unhealthy beverages, such as soda and fruit drinks are perceived by millennials as "outdated". Millennials have started avoiding purchasing these products, which has led to an increase in demand for healthier options. Currently, health-related claims are the second most common type of claim on beverage labels behind "natural".
Chocolate's use in a beverage is growing fast in the US and a wide range of chocolate drinks can now be found everywhere from restaurants and airport lounges to supermarkets and grocery stores, making them easy to acquire for those who suddenly develop a taste for them. While traditional hot chocolate consists of melted chocolate mixed with hot water or milk, the drinks are gaining popularity because they are made with premium ingredients without preservatives, artificial flavors or colors.
U.S. Chocolate Beverage Powder Market: Report Scope
| Report Attributes | Report Details |
|---|---|
| Report Name | U.S. Chocolate Beverage Powder Market |
| Market Size in 2023 | USD 3.18 Billion |
| Market Forecast in 2032 | USD 5.92 Billion |
| Growth Rate | CAGR of 6.4% |
| Number of Pages | 160 |
| Key Companies Covered | Nestle, Mars, Pepsico, Mondelez, kanegrade, and Hershey’s, among others |
| Segments Covered | By Type, By Packaging Format, By Distribution Channel, By Packaging Size, And By Region |
| Regions Covered | North America, Europe, Asia Pacific (APAC), Latin America, Middle East, and Africa (MEA) |
| Base Year | 2023 |
| Historical Year | 2018 to 2022 |
| Forecast Year | 2024 - 2032 |
| Customization Scope | Avail customized purchase options to meet your exact research needs. Request For Customization |
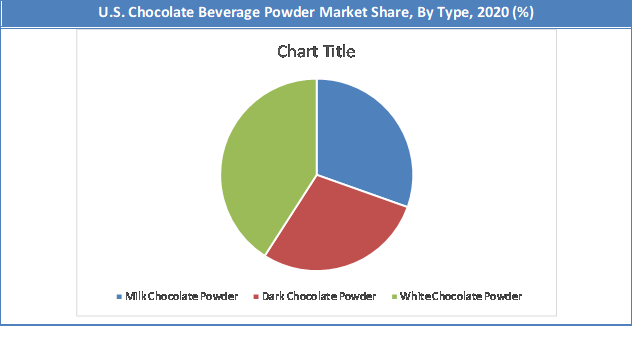
Type Analysis Preview
The white chocolate powder segment held a share of around 40.94% in 2020. This drink is targeted at younger customers who like to experiment with the different tastes they could get from drinks than older people who enjoy drinking white chocolate powder drink which mostly consists of milk and sugar taste due to its traditional character. The demand for this product over the last five years has been increasing every year because it offers an alternative to other milk drinks such as dairy coffee and yogurt. However, there is still a price problem that may cause potential customers not to buy this product; therefore, marketers should give more attention to this problem.
 Request Free SampleRequest Free Sample
Distribution Channel Segment Analysis Preview
The hypermarkets/Supermarkets segment is expected to grow at a CAGR of over 4.3% from 2024 to 2032. In today's society, people are living very busy life. With the increasing pressure from work and family, many consumers live a fast-paced lifestyle which has changed their quality of life. This has led to a significant change in consumer buying behaviors as they look for convenience and products that can help them manage the numerous demands on their time. In this modern society, people have a lot of different choices when it comes to beverages. When consumers look for the right beverage that suits their needs at home or when they are on the go, convenience is a major consideration. Consumers would choose to buy from the supermarket instead of other places such as specialty shops because supermarkets offer more convenient services and have wider product offerings.
Regional Analysis Preview
U.S. is growing at 4.2% CAGR from 2021 to 2028. In dollar sales, the natural channel has been experiencing a steady increase in demand since 2013, growing from $28.9 billion to over $33.5 billion from 2016 to 2017. This is a result of an increase in demand for healthy beverages driven by health-conscious millennials. Healthy beverage consumption has increased significantly due to functional benefits and greater access to these products. The overall market will continue growing as long as new and unique functional benefits are added and new products are created with the goal of satisfying consumer demands while also providing them with some sort of benefit that can improve their daily lives.
Key Market Players & Competitive Landscape
Some of the key players in the U.S. Chocolate Beverage Powder Market are
- Nestle
- Mars
- Pepsico
- Mondelez
- kanegrade
- Hershey’s
The U.S. Chocolate Beverage Powder Market is segmented as follows:
By Type
- Milk Chocolate Powder
- Dark Chocolate Powder
- White Chocolate Powder
By Packaging Format
- Metal Containers
- Plastic Containers
- Cartons
- Pouches
- Others
By Distribution Channel
- Hypermarkets/Supermarkets
- Food and Drug mass
- CLubs
- E-Commerce
- Specialty
- Global Travel Retail
By Packaging Size
- Up to 500 Grams
- 501–1,000 Grams
- 1,000–1,500 Grams
- More than 1,500 Grams
By Region
- North America
- The U.S.
- Canada
- Europe
- France
- The UK
- Spain
- Germany
- Italy
- Rest of Europe
- Asia Pacific
- China
- Japan
- India
- South Korea
- Southeast Asia
- Rest of Asia Pacific
- Latin America
- Brazil
- Mexico
- Rest of Latin America
- Middle East & Africa
- GCC
- South Africa
- Rest of Middle East & Africa
Table Of Content
Methodology
FrequentlyAsked Questions
HappyClients

