Global E-commerce Logistics Market Size, Share, Growth Analysis Report - Forecast 2034

E-commerce Logistics Market By Service Type (Transportation, Warehousing, Value-Added Services (labeling, packaging, etc.)), By Operational Area (Domestic, International), By Mode of Transportation (Road, Rail, Air, Sea), By Business Type (B2B, B2C), By Product Category (Electronics, Apparel, Food & Beverages, Personal Care, Household Goods, Others), and By Region: Global and Regional Industry Overview, Market Intelligence, Comprehensive Analysis, Historical Data, and Forecasts 2025 - 2034
| Market Size in 2024 | Market Forecast in 2034 | CAGR (in %) | Base Year |
|---|---|---|---|
| USD 500.24 Billion | USD 3744.93 Billion | 22.3% | 2024 |
Global E-commerce Logistics Market: Industry Perspective
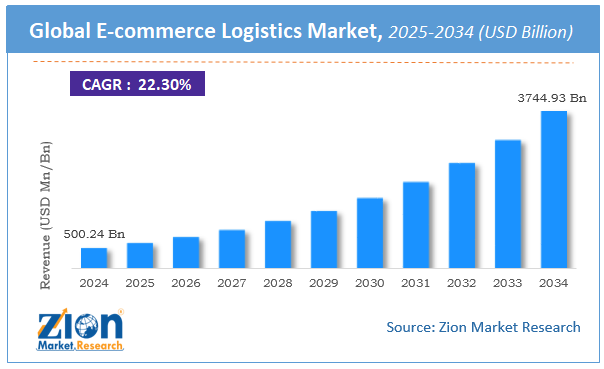
The global e-commerce logistics market size was worth around USD 500.24 Billion in 2024 and is predicted to grow to around USD 3744.93 Billion by 2034 with a compound annual growth rate (CAGR) of roughly 22.3% between 2025 and 2034. The report analyzes the global e-commerce logistics market's drivers, restraints/challenges, and the effect they have on the demands during the projection period. In addition, the report explores emerging opportunities in the e-commerce logistics industry.
 Request Free SampleRequest Free Sample
Logistic service enables e-commerce merchants to outsource services including transportation, warehousing, shipping, and other value-added services such as return management and urgent parcel service. The spread of e-commerce and the resulting rise in the number of online buyers, especially in emerging economies is anticipated to give rise to market growth.
Regardless of what type of business it is to say, a manufacturer, wholesaler, or retailer, and no matter what category of products the business is selling, now is the time to adopt digital transformation. Omnichannel will become a norm in the coming years and E-Commerce logistics will have a demand like never before.
Key Insights
- As per the analysis shared by our research analyst, the global e-commerce logistics market is estimated to grow annually at a CAGR of around 22.3% over the forecast period (2025-2034).
- Regarding revenue, the global e-commerce logistics market size was valued at around USD 500.24 Billion in 2024 and is projected to reach USD 3744.93 Billion by 2034.
- The e-commerce logistics market is projected to grow at a significant rate due to booming online retail, demand for fast and reliable delivery services, technological advancements in supply chain management, and international cross-border trade.
- Based on Service Type, the Transportation segment is expected to lead the global market.
- On the basis of Operational Area, the Domestic segment is growing at a high rate and will continue to dominate the global market.
- Based on the Mode of Transportation, the Road segment is projected to swipe the largest market share.
- By Business Type, the B2B segment is expected to dominate the global market.
- In terms of Product Category, the Electronics segment is anticipated to command the largest market share.
- Based on region, Asia-Pacific is predicted to dominate the global market during the forecast period.
E-commerce Logistics Market: Growth Factors
One of the major reasons for the e-commerce logistics market to flourish is due to an increase in internet penetration, a rise in the adoption of smartphones, favorable demographics, the surge in acceptability of online payment, and the emergence of several new e-commerce players on social media. Further, supportive government initiatives to boost infrastructure development and implantation of laws which support like GST in India, have improved the delivery of e-commerce goods across the globe. Moreover, the indirect growth of the e-commerce logistics market is growing m-commerce sales, internet and mobile penetration, highly advanced door-to-door shipping, convenient payment methods, exciting discounts, and expansion into the new emerging markets through e-business.
It helps the market players to scrutinize in-depth market trends and outlook coupled with the factors driving the market, as well as those hindering it. Enhance the decision-making process by understanding the strategies that underpin commercial interest with respect to client products, segmentation, and distribution. E-commerce logistics market is expected to grow substantially is forecasted period.
 Request Free SampleRequest Free Sample
Global E-commerce Logistics Market: Segmentation Analysis
The global e-commerce logistics market is segmented based on Service Type, Operational Area, Mode of Transportation, Business Type, Product Category, and region.
Based on Service Type, the global e-commerce logistics market is divided into Transportation, Warehousing, Value-Added Services (labeling, packaging, etc.).
On the basis of Operational Area, the global e-commerce logistics market is bifurcated into Domestic, International.
By Mode of Transportation, the global e-commerce logistics market is split into Road, Rail, Air, Sea.
In terms of Business Type, the global e-commerce logistics market is categorized into B2B, B2C.
By Product Category, the global Global E-commerce Logistics market is divided into Electronics, Apparel, Food & Beverages, Personal Care, Household Goods, Others.
Global E-commerce Logistics Market: Report Scope
| Report Attributes | Report Details |
|---|---|
| Report Name | Global E-commerce Logistics Market |
| Market Size in 2024 | USD 500.24 Billion |
| Market Forecast in 2034 | USD 3744.93 Billion |
| Growth Rate | CAGR of 22.3% |
| Number of Pages | PagesNO |
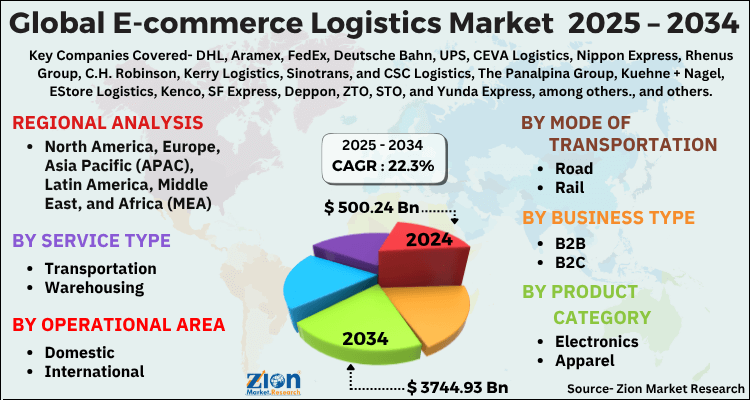
| Key Companies Covered | DHL, Aramex, FedEx, Deutsche Bahn, UPS, CEVA Logistics, Nippon Express, Rhenus Group, C.H. Robinson, Kerry Logistics, Sinotrans, and CSC Logistics, The Panalpina Group, Kuehne + Nagel, EStore Logistics, Kenco, SF Express, Deppon, ZTO, STO, and Yunda Express, among others., and others. |
| Segments Covered | By Service Type, By Operational Area, By Mode of Transportation, By Business Type, By Product Category, and By Region |
| Regions Covered | North America, Europe, Asia Pacific (APAC), Latin America, The Middle East and Africa (MEA) |
| Base Year | 2024 |
| Historical Year | 2020 to 2024 |
| Forecast Year | 2025 to 2034 |
| Customization Scope | Avail customized purchase options to meet your exact research needs. Request For Customization |
E-commerce Logistics Market: Regional Analysis Preview
The Asia Pacific region held a share of 40% in 2020. This is attributable to the presence of top buyers of digital and online shopping. Moreover, the increasing usage of E-Commerce Logistics in various sectors is expected to generate huge demand for the market in this region.
The Asia Pacific region is projected to grow at a CAGR of 20.4% over the forecast period. This is also the highest growing region owing to growing customers and mobile phone users in this region. Also, tapping of untapped markets like rural sectors in developing economies like India is fueling the market. Moreover, countries such as China, Japan, and South Korea are among the top 10 exporters of merchandise and account for a large portion of global e-commerce sales.
Global E-commerce Logistics Market: Competitive Analysis
The report provides a company market share analysis to give a broader overview of the key market players. In addition, the report also covers key strategic developments of the market, including acquisitions & mergers, new product launches, agreements, partnerships, collaborations & joint ventures, research & development, and regional expansion of major participants involved in the e-commerce logistics market on a global and regional basis.
The global e-commerce logistics market is dominated by players like:
- DHL
- Aramex
- FedEx
- Deutsche Bahn
- UPS
- CEVA Logistics
- Nippon Express
- Rhenus Group
- C.H. Robinson
- Kerry Logistics
- Sinotrans
- and CSC Logistics
- The Panalpina Group
- Kuehne + Nagel
- EStore Logistics
- Kenco
- SF Express
- Deppon
- ZTO
- STO
- Yunda Express
The global e-commerce logistics market is segmented as follows;
By Service Type
- Transportation
- Warehousing
- Value-Added Services (labeling packaging etc.)
By Operational Area
- Domestic
- International
By Mode of Transportation
- Road
- Rail
- Air
- Sea
By Business Type
- B2B
- B2C
By Product Category
- Electronics
- Apparel
- Food & Beverages
- Personal Care
- Household Goods
- Others
By Region
- North America
- The U.S.
- Canada
- Europe
- France
- The UK
- Spain
- Germany
- Italy
- Rest of Europe
- Asia Pacific
- China
- Japan
- India
- South Korea
- Southeast Asia
- Rest of Asia Pacific
- Latin America
- Brazil
- Mexico
- Rest of Latin America
- Middle East & Africa
- GCC
- South Africa
- Rest of the Middle East & Africa
Table Of Content
Methodology
FrequentlyAsked Questions
Logistic service enables e-commerce merchants to outsource services including transportation, warehousing, shipping, and other value-added services such as return management and urgent parcel service.
The global e-commerce logistics market is expected to grow due to booming online retail, demand for fast and reliable delivery services, technological advancements in supply chain management, and international cross-border trade.
According to a study, the global e-commerce logistics market size was worth around USD 500.24 Billion in 2024 and is expected to reach USD 3744.93 Billion by 2034.
The global e-commerce logistics market is expected to grow at a CAGR of 22.3% during the forecast period.
Asia-Pacific is expected to dominate the e-commerce logistics market over the forecast period.
Leading players in the global e-commerce logistics market include DHL, Aramex, FedEx, Deutsche Bahn, UPS, CEVA Logistics, Nippon Express, Rhenus Group, C.H. Robinson, Kerry Logistics, Sinotrans, and CSC Logistics, The Panalpina Group, Kuehne + Nagel, EStore Logistics, Kenco, SF Express, Deppon, ZTO, STO, and Yunda Express, among others., among others
The report explores crucial aspects of the e-commerce logistics market, including a detailed discussion of existing growth factors and restraints, while also examining future growth opportunities and challenges that impact the market.
HappyClients

