Smart TV Market Size, Share, And Growth Report 2032

Smart TV Market by Resolution (HD, Full HD, 4KHD, and 8KHD), by Screen Size (Below 32 Inches, 32 to 40 Inches, 40 to 47 Inches, 48 to 55 Inches, and Above 55 Inches), by Technology (OLED, QLED, LED, Plasma, and Others), by Screen Type (Curved and Flat), by Distribution Channel (Online, Single Brand Stores, and Multi Brand Stores), by End-Use (Commercial and Residential), and By Region - Global And Regional Industry Overview, market Intelligence, Comprehensive Analysis, Historical Data, And Forecasts 2024-2032
| Market Size in 2023 | Market Forecast in 2032 | CAGR (in %) | Base Year |
|---|---|---|---|
| USD 219.73 Billion | USD 575.90 Billion | 11.3% | 2023 |
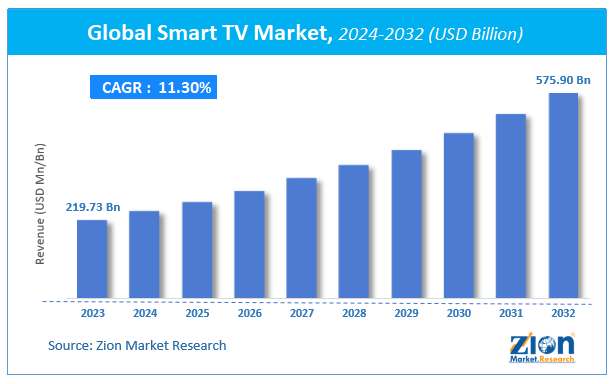
Smart TV Market: Size
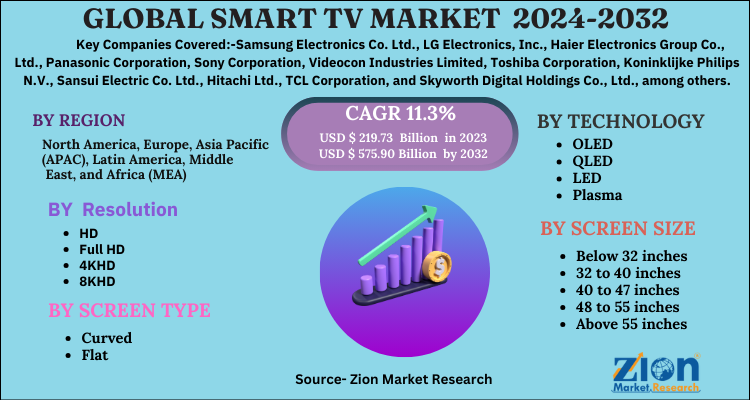
The global Smart TV Market size was worth around USD 219.73 billion in 2023 and is predicted to grow to around USD 575.90 billion by 2032 with a compound annual growth rate (CAGR) of roughly 11.3% between 2024 and 2032.
The study provides historical data from 2018 to 2022 along with a forecast from 2024 to 2032 based on revenue (USD billion). The report covers a forecast and an analysis of the Smart TV Market on a global and regional level.
 Request Free SampleRequest Free Sample
Smart TV Market: Overview
The global smart TV market will witness a notable growth in the future, owing to the rising disposable income of people, particularly in developing countries of the Asia Pacific region. This has led to the rise in the demand for 4KHD TVs, which can be seen by the increase in the number of 4K TV units’ shipments. In 2016, the number of 4KHD TVs shipped was 48 million units in comparison to 10.1 million units during 2014. China is a key supplier of 4KHD TVs, as it contributed about 43% to the overall 4K TV shipments. TV Manufacturers, such as LG, Panasonic, and Samsung, are focusing on collaborating with numerous regional suppliers of smart TV components to leverage their product offerings. This, in turn, will further help the smart TV market to expand in the coming years.
The increasing use of various online channels is fueling the market smart TV growth. In 2018, about 70% of Americans with an income of USD 150 thousand or more were subscribed to Amazon Prime. The number of online subscribers for shopping is increasing annually. In 2018, the global online consumers reached 1.62 billion as compared to 1.07 billion in 2013. This number is expected to rise due to the massive adoption of mobile shopping, which Thus, it is anticipated that the large-scale use of online platforms will further boost the smart TV market growth in the future. However, technical issues, such as the burn-in issue in OLED displays, may be a major constraint in the smart TV market. Additionally, the increasing adoption of 8KHD TVs will open new growth avenues in the market in the future.
 Request Free SampleRequest Free Sample
Smart TV Market: Segmentation
The study provides a crucial view of the smart TV by segmenting the market based on the resolution, screen size, technology, screen type, distribution channel, end-use, and region. All the segments of the smart TV market have been analyzed based on present and future trends and the market is estimated from 2024 to 2032.
HD, Full HD, 4KHD, and 8KHD form the resolution segment of the global smart TV market.
Below 32 inches, 32 to 40 inches, 40 to 47 inches, 48 to 55 inches, and above 55 inches from the screen size segment.
The technology segment includes OLED, QLED, LED, Plasma, and others.
Curved and flat screens comprise the screen type segment.
The distribution channel includes online, single brand stores, and multi-brand stores. Commercial and residential sectors form the end-use segment of the market.
Smart TV Market: Report Scope
| Report Attributes | Report Details |
|---|---|
| Report Name | Smart TV Market |
| Market Size in 2023 | USD 219.73 Billion |
| Market Forecast in 2032 | USD 575.90 Billion |
| Growth Rate | CAGR of 11.3% |
| Number of Pages | 197 |
| Key Companies Covered | Samsung Electronics Co. Ltd., LG Electronics, Inc., Haier Electronics Group Co., Ltd., Panasonic Corporation, Sony Corporation, Videocon Industries Limited, Toshiba Corporation, Koninklijke Philips N.V., Sansui Electric Co. Ltd., Hitachi Ltd., TCL Corporation, and Skyworth Digital Holdings Co., Ltd., among others |
| Segments Covered | By resolution, By screen size, By technology, By screen type, By distribution channel, By end-use and By Region |
| Regions Covered | North America, Europe, Asia Pacific (APAC), Latin America, Middle East, and Africa (MEA) |
| Base Year | 2023 |
| Historical Year | 2018 to 2022 |
| Forecast Year | 2024 - 2032 |
| Customization Scope | Avail customized purchase options to meet your exact research needs. Request For Customization |
Smart TV Market: Regional Analysis
The regional segment comprises the current and forecast demand for the Middle East and Africa, North America, Asia Pacific, Latin America and Europe with further division into the U.S., Canada, Mexico, UK, Germany, France, Spain, Italy, China, Japan, India, South Korea, Taiwan, Brazil, Argentina, UAE, Saudi Arabia, and South Africa.
By region, North America is anticipated to hold a considerable share of the global smart TV market over the forecast time period. The U.S. is considered as the key contributor to this regional market due to the increasing demand for smart TVs in the residential sector. Europe is anticipated to witness a significant rise in the demand for smart TVs due to the escalating product popularity in hotels, restaurants, retail outlets, and other commercial places.
Smart TV Market: Competitive Players
Some noticeable players of the global smart TV market are:
- Samsung Electronics Co. Ltd.
- LG Electronics Inc.
- Haier Electronics Group Co. Ltd.
- Panasonic Corporation
- Sony Corporation
- Videocon Industries Limited
- Toshiba Corporation
- Koninklijke Philips N.V.
- Sansui Electric Co. Ltd.
- Hitachi Ltd.
- TCL Corporation
- Skyworth Digital Holdings Co. Ltd.
The Global Smart TV Market is segmented as follows:
Global Smart TV Market: Resolution Analysis
- HD
- Full HD
- 4KHD
- 8KHD
Global Smart TV Market: Screen Size Analysis
- Below 32 inches
- 32 to 40 inches
- 40 to 47 inches
- 48 to 55 inches
- Above 55 inches
Global Smart TV Market: Technology Analysis
- OLED
- QLED
- LED
- Plasma
- Others
Global Smart TV Market: Screen Type Analysis
- Curved
- Flat
Global Smart TV Market: Distribution Channel Analysis
- Online
- Single Brand Stores
- Multi Brand Stores
Global Smart TV Market: End-Use Analysis
- Residential
- Commercial
Global Smart TV Market: Regional Analysis
- North America
- The U.S.
- Europe
- UK
- France
- Germany
- Asia Pacific
- China
- Japan
- India
- Latin America
- Brazil
- Middle East and Africa
Table Of Content
Methodology
FrequentlyAsked Questions
A Smart TV is a television that integrates internet connectivity and interactive web features, allowing users to access streaming services, browse the web, use apps, and more, all from their TV screen.
According to study, the Smart TV Market size was worth around USD 219.73 billion in 2023 and is predicted to grow to around USD 575.90 billion by 2032.
The CAGR value of Smart TV Market is expected to be around 11.3% during 2024-2032.
North America has been leading the Smart TV Market and is anticipated to continue on the dominant position in the years to come.
The Smart TV Market is led by players like Samsung Electronics Co. Ltd., LG Electronics Inc., Haier Electronics Group Co., Ltd., Panasonic Corporation, Sony Corporation, Videocon Industries Limited, Toshiba Corporation, Koninklijke Philips N.V., Sansui Electric Co. Ltd., Hitachi Ltd., TCL Corporation, and Skyworth Digital Holdings Co. Ltd., among others.
HappyClients

