Sales Performance Management Market Size, Share, Analysis, Trends, Growth Report, 2032

Sales Performance Management Market by Solutions (Incentive Compensation Management (ICM), Sales Planning and Monitoring, Sales Performance Analytics and Reporting, Territory Management, and Others), by Services (Training and Education, Support and Maintenance, Consulting Services, and Integration and Implementation), by Organization Size (Large Enterprises, and Small and Medium-sized Enterprises (SMEs)), by Deployment Model (On-premises, and Cloud-based), by Industry Vertical (Banking, Financial Services, and Insurance (BFSI), Healthcare and Pharmaceuticals, Manufacturing, IT and Telecommunications, Consumer Goods and Retail, Energy and Utilities, Media and Entertainment, and Others): Global Industry Perspective, Comprehensive Analysis and Forecast, 2024 - 2032
| Market Size in 2023 | Market Forecast in 2032 | CAGR (in %) | Base Year |
|---|---|---|---|
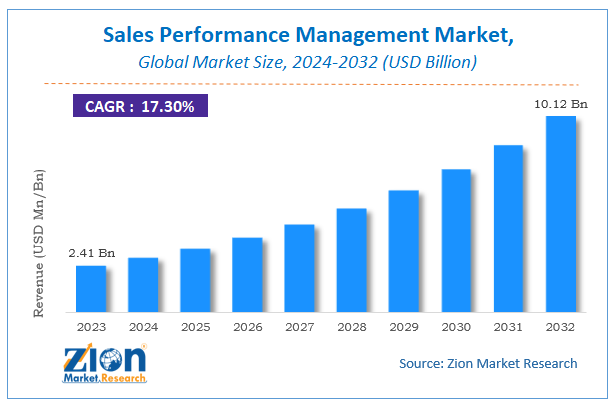
| USD 2.41 Billion | USD 10.12 Billion | 17.3% | 2023 |
Sales Performance Management Market Insights
According to a report from Zion Market Research, the global Sales Performance Management Market was valued at USD 2.41 Billion in 2023 and is projected to hit USD 10.12 Billion by 2032, with a compound annual growth rate (CAGR) of 17.3% during the forecast period 2024-2032. This report explores market strengths, weakness, opportunities, and threats. It also provides valuable insights into the market's growth drivers, challenges, and the future prospects that may emerge in the Sales Performance Management Market industry over the next decade.
Sales Performance Management Market: Overview
The report analyzes the global Sales performance management (SPM) market drivers, restraints/challenges, and the effect they have on the demands during the projection period. In addition, the report explores emerging opportunities in the Sales performance management (SPM) industry.
Sales performance management (SPM) is a combination of operational and analytical functions that are used to automate back-office operational sales processes and is implemented in order to improve operational efficiency and effectiveness. Sales performance management functions include incentive compensation management, quota management and planning, territory management, advanced analytics, and gamification.
Sales performance is important for the sales team and the organization, for selling activities and to accomplish sales goals. The market is primarily driven by the increasing adoption of sales performance management solutions by organizations. The growing technological advancements with the integration of machine learning and natural language processing revolutions to control data-driven recommendations are anticipated to augment the market in the years to come.
Sales Performance Management Market: COVID-19 Impact Analysis
The COVID-19 pandemic has caused disruptions in every industry. With the in-demand work-from-home culture, worldwide lockdowns, and economic unsteadiness due to COVID-19, the evolution and change towards cloud-based solutions have increased and organizations have started adopting the cloud environments for improving their planning and management of incentives, compensations, and quotas. It also enhances the performance of sales representatives due to easy cloud technology and its advantages, which has further supported the market growth. Although reduced usage of SPM by small and medium-sized enterprises (SMEs) due to their investments in other technologies, time-consuming and costly process, and decreased returns, has somewhat hampered the growth of the sales performance management market.
Sales Performance Management Market: Growth Factors
The increasing automation solutions to improve visibility and avoid calculation inaccuracies are anticipated to augment the market over the next six years. Sales sectors are troubled by automating returns and payment plans, appraisals, quotas, and territory mapping with the current digitalization and automation across organizations. The use of SPM solutions provides a quick and precise view of the SPM processes to both representatives and supervisors. It also helps remove variable pay irregularities and increases productivity.
The various benefits offered by sales performance management include a stronger sales pipeline, better-qualified sales opportunities, better sales analytics, improved forecast accuracy, more effective territory management, greater ROI on sales enablement and training, and healthier profit margins, among others. Organizations that implement operative sales performance management constantly help them outperform their peers. These advantages thus led organizations to use SPM solutions for improved productivity and development and hence augment the growth of the sales performance market in the years to come.
The rising adoption of sales performance management by organizations is anticipated to augment the market growth over the forecast period. Companies such as SAP, Oracle, Xactly, and Salesforce are focusing on developing more improved automated and on-premise as well as cloud-based sales performance management solutions to help enterprises to maximize profits by automating and optimizing sales execution. As a result, the demand for automated SPM solutions for effective management of operations in the sales sector in organizations has increased.
Sales Performance Management Market: Report Scope
| Report Attributes | Report Details |
|---|---|
| Report Name | Sales Performance Management Market |
| Market Size in 2023 | USD 2.41 Billion |
| Market Forecast in 2032 | USD 10.12 Billion |
| Growth Rate | CAGR of 17.3% |
| Number of Pages | 140 |
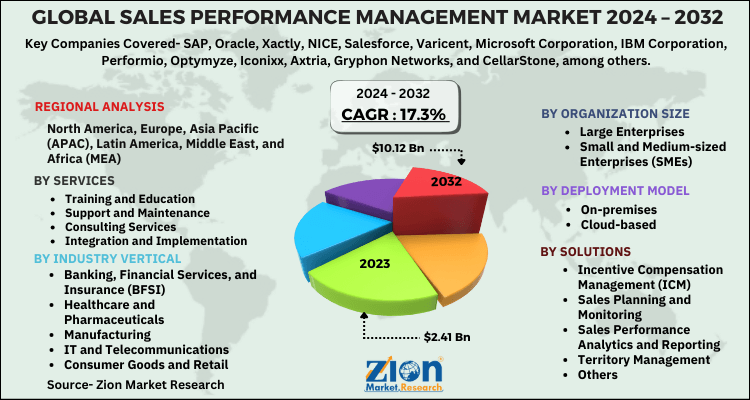
| Key Companies Covered | SAP, Oracle, Xactly, NICE, Salesforce, Varicent, Microsoft Corporation, IBM Corporation, Performio, Optymyze, Iconixx, Axtria, Gryphon Networks, and CellarStone, among others |
| Segments Covered | By Solutions, By Services, By Organization Size, By Deployment Model, By Industry Vertical, And By Region |
| Regions Covered | North America, Europe, Asia Pacific (APAC), Latin America, Middle East, and Africa (MEA) |
| Base Year | 2023 |
| Historical Year | 2018 to 2022 |
| Forecast Year | 2024 - 2032 |
| Customization Scope | Avail customized purchase options to meet your exact research needs. Request For Customization |
Deployment Model Segment Analysis Preview
On-premises segment held the maximum share in 2020 in the sales performance management market. This is attributable to the growing demand for customized solutions by organizations as per their requirements, especially for large enterprises and companies that are related to data security and privacy concerns. The on-premise sales performance management solutions offer the same high data security and extra privacy to these highly regulated industries. The on-premise type of deployment model is mostly used by large organizations with wide-ranging data and design needs and sufficient sales personnel.
Industry Vertical Segment Analysis Preview
Banking, Financial Services, and Insurance (BFSI) segment is projected to hold the maximum share in the years to come. This is attributable to the increasing demand by BFSI companies to deal with its wide range of insurance and banking products, which includes debit and credit cards, various types of loans, and different insurance policies. These numerous operations involve and need the employment of a huge number of sales representatives, to manage incentive compensation plans, estimate compensation payouts, and quota allocations, and encourage the sales team and align their goals with strategic objectives has led the BFSI sector to adopt SPM solutions.
Regional Analysis Preview
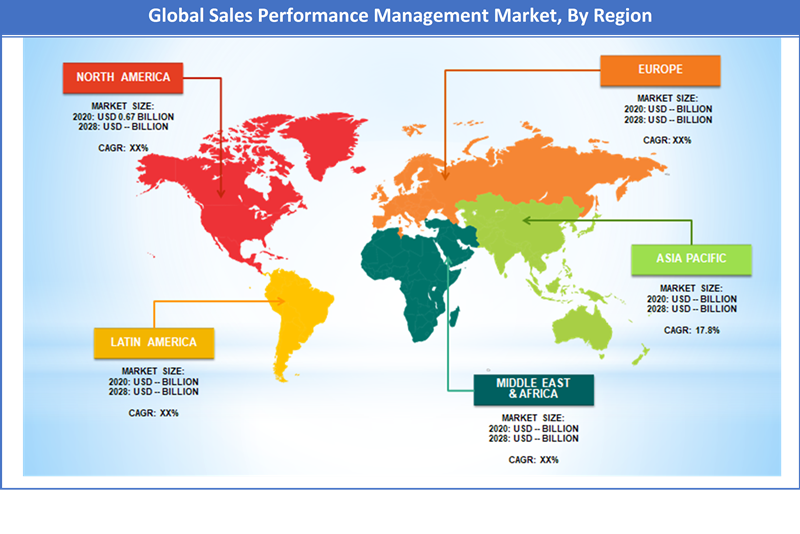
The North American region held a share of 39.2 % in 2023. This is attributable to the early adoption of advanced technologies which include sales performance management solutions in the region. The presence of top companies in the region needs these solutions as they need important marketing strategies to improve their client count across the world. Moreover, the increasing adoption of SPM solutions in various industries is expected to generate huge demand for the market in this region.
The Asia Pacific region is projected to grow at a CAGR of 17.8 % over the forecast period. This surge is due to the increasing adoption of this technology by developing economies like China and India in the region. Enterprises are using automated sales performance solutions in their sales department to calculate variable sales compensation and decrease the chances of disputes throughout the sales cycle with compensation visibility. Additionally, the adoption of automated solutions by various industries and businesses is expected to open new opportunities for the sales performance management market over the coming years.
Sales Performance Management Market: Competitive Landscape
Some of the key players in the sales performance management market are
- SAP
- Oracle
- Xactly
- NICE
- Salesforce
- Varicent
- Microsoft Corporation
- IBM Corporation
- Performio
- Optymyze
- Iconixx
- Axtria
- Gryphon Networks
- CellarStone
- among others.
Companies are focusing on acquisition and collaboration to leverage their market share. For instance, on Jan 20, Varicent announced the acquisition of FunnelCake solution company. The acquisition of the company was done as the strategic expansion of Varicent's sales performance management product line.
Companies are also focusing on launching new products to enhance their product offerings and gain a competitive advantage in the market. For instance, in December 2020, Xactly announced the launch of Operational Sales Management (OSM). It automates the administration of the day-to-day change that inevitably occurs within a sales organization.
The global sales performance management market is segmented as follows:
By Solutions
- Incentive Compensation Management (ICM)
- Sales Planning and Monitoring
- Sales Performance Analytics and Reporting
- Territory Management
- Others
By Services
- Training and Education
- Support and Maintenance
- Consulting Services
- Integration and Implementation
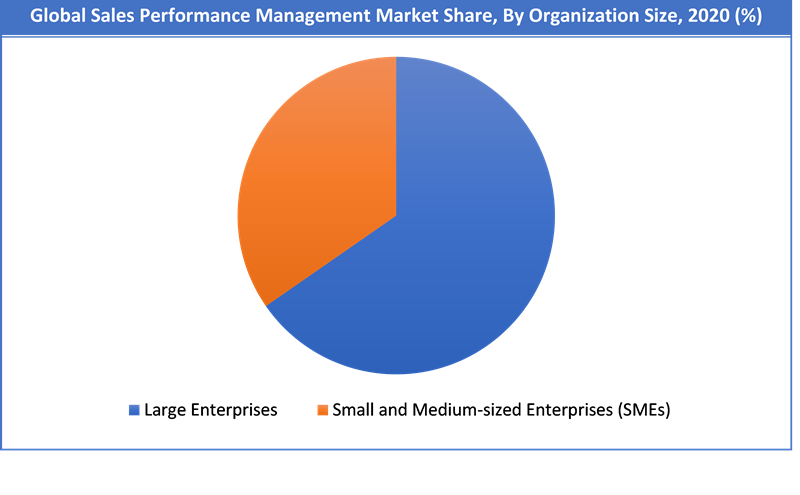
By Organization Size
- Large Enterprises
- Small and Medium-sized Enterprises (SMEs)
By Deployment Model
- On-premises
- Cloud-based
By Industry Vertical
- Banking, Financial Services, and Insurance (BFSI)
- Healthcare and Pharmaceuticals
- Manufacturing
- IT and Telecommunications
- Consumer Goods and Retail
- Energy and Utilities
- Media and Entertainment
- Others
By Region
- North America
- The U.S.
- Canada
- Europe
- France
- The UK
- Spain
- Germany
- Italy
- Rest of Europe
- Asia Pacific
- China
- Japan
- India
- South Korea
- Southeast Asia
- Rest of Asia Pacific
- Latin America
- Brazil
- Mexico
- Rest of Latin America
- Middle East & Africa
- GCC
- South Africa
- Rest of Middle East & Africa
Table Of Content
Methodology
FrequentlyAsked Questions
The global sales performance management market was valued at USD 2.41 Billion in 2023.
The global sales performance management market is expected to reach USD 10.12 Billion by 2032, growing at a CAGR of 17.3% between 2024 to 2032.
Some of the key factors driving the global sales performance management market growth are increasing demand for metric-driven sales tools, increasing enterprise mobility to increase agent performance, and rising automation to improve visibility and avoid calculation inaccuracies, among others.
North America region held a substantial share of the sales performance management market in 2023. This is attributable to the early adoption of advance technologies which include sales performance management solutions in the region. Asia Pacific region is projected to grow at a significant rate owing to the rising demand for sales performance management in developing economies such as China and India.
Some of the major companies operating in the sales performance management market are SAP, Oracle, Xactly, NICE, Salesforce, Varicent, Microsoft Corporation, IBM Corporation, Performio, and Optymyze, among others.
List of Contents
Market InsightsOverviewCOVID-19 Impact AnalysisMarket:Growth FactorsReport ScopeDeployment Model Segment Analysis PreviewIndustry Vertical Segment Analysis PreviewRegional Analysis PreviewCompetitive LandscapeThe global sales performance management market is segmented as follows:By SolutionsBy Services By Organization SizeBy Deployment ModelBy Industry VerticalBy RegionHappyClients

