Online Presentation Software Market Size, Share, And Growth Report 2032

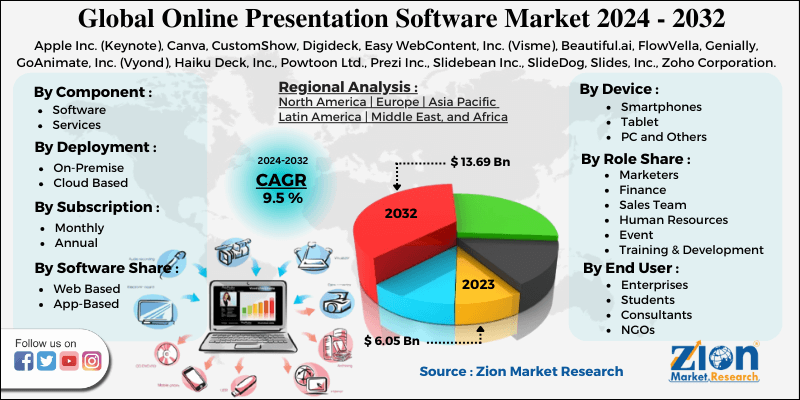
Online Presentation Software Market By Component (Software and Services), By Deployment ( On Premise and Cloud Based ), By Software Share( Web Based, and App Based), By Role Share ( Marketers, Finance, Sates Team, Human Resources, Event, Training and Development, and Others), By Device, (Smartphones, Tablet, PC, others), By Subscription (Monthly, and Annual), by End User (Enterprises, Students, Educators and Bloggers, Consultants, NGOs, and Others): Global Industry Perspective, Comprehensive Analysis and Forecast, 2024 - 2032-
| Market Size in 2023 | Market Forecast in 2032 | CAGR (in %) | Base Year |
|---|---|---|---|
| USD 6.05 Billion | USD 13.69 Billion | 9.5% | 2023 |
Online Presentation Software Market Size
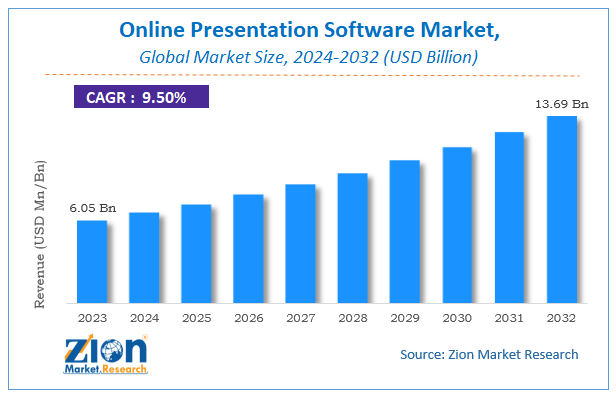
According to a report from Zion Market Research, the global Online Presentation Software Market was valued at USD 6.05 Billion in 2023 and is projected to hit USD 13.69 Billion by 2032, with a compound annual growth rate (CAGR) of 9.5% during the forecast period 2024-2032. This report explores market strengths, weakness, opportunities, and threats. It also provides valuable insights into the market's growth drivers, challenges, and the future prospects that may emerge in the Online Presentation Software Market industry over the next decade.
Global Online Presentation Software Market: Overview
The online presentation software permits users to customize the pre-built template according to the requirement and share it by generating a link. There is much software through which online presentations can be made. The software allows the user to see advanced analytics, for instance, one can receive real-time notifications with respect to when one has viewed the presentation and its duration. The software is also used by sales and accounts teams of companies in order to save time and cost as well as easy sharing of unlimited file sizes. The increased number of businesses as well as the increasing number of start-ups will drive the growth of the presentation software Market. Its growth in the marketing research industry will drive the market demand
Global Online Presentation Software Market: Growth Factors
Online presentations are really beneficial in terms of time-saving and cost-effective procedures for communicating training and learning processes. No matter how long the presentations are, as they can be stored they can be viewed in real-time. Online presentations used for business development can supplement better graphics and diagrams which in turn lead to innovative ways. The benefits of online presentations give a lot of visual information and a better understanding of problems. Interactive presentations with controlled playback speed, sound and visual effect help to understand better about the product or service.
With the development of high technology in smartphones, tablets, and modern computers with the use of innovative software, presentations are made in less time and viewed by clients in no time. As people realize the long time benefits of the online presentation software market it is expected to experience a boom in the coming years. However, Security concerns are likely to hamper the growth of the market as presentations carry confidential data of a particular company, and cyber-attacks on the servers may pose a security threat to the data.
The issues include server penetration attacks, client-device malware, denial online service attacks, and others which are hampering the growth of the online presentation software market. The rapid pace of digitization is changing the dynamics of industrial processes and even transforming economies and societies. Digitization has transformed global trade, and investment patterns and at the same time has created severe challenges such as increasing cyber security concerns. The swift penetration of smartphones combined with the rising number of internet users has stimulated the pace of digitization. The increasing usage of the smartphone has paved the way for digitization at the ground level even in developing economies. This is a major opportunity for the online presentation software market to boom in the upcoming years.
Global Online Presentation Software Market: Segmentation
The global Online Presentation Software market can be segmented into component, deployment, software share, role share, device, end user, and region. Among component services segment is likely to grow faster owing to the fact that the Software as a service model of the business is showing lucrative results for the industry.
By deployment cloud-based segment is growing rapidly due to growth in the software as a service model. Amongst software types, web-based software and app-based software both are growing rapidly by more than 9% annually.
Web-based software is higher in demand as one does not need to download the software. It is hosted on multiple servers and can be connected remotely. By role, it is anticipated that the marketing role will lead all other roles as the major end result is marketing.
By device, segment smartphone segment is likely to grow fastest as smartphone penetration is increasing day by day. By subscription, the annual segment will grow faster owing to the fact that educational institutes and corporate organizations prefer to take an annual subscription. By end user, consultants are the biggest end user of the market and this segment has great potential for fueling the growth of the market.
Online Presentation Software Market: Report Scope
| Report Attributes | Report Details |
|---|---|
| Report Name | Online Presentation Software Market |
| Market Size in 2023 | USD 6.05 Billion |
| Market Forecast in 2032 | USD 13.69 Billion |
| Growth Rate | CAGR of 9.5% |
| Number of Pages | 110 |
| Key Companies Covered | Apple Inc. (Keynote), Canva, CustomShow, Digideck, Easy WebContent, Inc. (Visme), Beautiful.ai, FlowVella, Genially, GoAnimate, Inc. (Vyond), Haiku Deck, Inc., Powtoon Ltd., Prezi Inc., Slidebean Inc., SlideDog, Slides, Inc., Zoho Corporation Pvt. Ltd., amongst others. |
| Segments Covered | By Component, By Deployment, By Software Share, By Role Share, By Device, By End-User, And By Region |
| Regions Covered | North America, Europe, Asia Pacific (APAC), Latin America, Middle East, and Africa (MEA) |
| Base Year | 2023 |
| Historical Year | 2018 to 2022 |
| Forecast Year | 2024 - 2032 |
| Customization Scope | Avail customized purchase options to meet your exact research needs. Request For Customization |
Global Online Presentation Software Market: Regional Analysis
Based on regions, the global Online Presentation Software market can be divided into five main regions: North America, Europe, Asia Pacific, Latin America, and the Middle East and Africa. North America region had a dominant share in terms of revenue in 2023, followed by Europe and Asia Pacific. The increase in the scenario of remote working has had a very much impact on the online presentation software market. Online presentation software is used by multinational companies having a presence across the world.
Nowadays even small and medium enterprises have moved towards presentation in order to coordinate with remotely situated teams. Multi-lingual features added as an upgrade are likely to increase the use of the software. APAC region is expected to show the highest growth during the forecast period. The growth of startups in China and Asia and the government initiatives to create an investment and the investor-friendly atmosphere is lending fillip to the growth of the market
Global Online Presentation Software Market: Competitive Players
Some of the players operating in the online presentation software market are
- Apple Inc. (Keynote)
- Canva
- CustomShow
- Digideck
- Easy WebContent, Inc. (Visme)
- Beautiful.ai
- FlowVella
- Genially
- GoAnimate, Inc. (Vyond)
- Haiku Deck, Inc.
- Powtoon Ltd.
- Prezi Inc.
- Slidebean Inc.
- SlideDog
- Slides, Inc.
- Zoho Corporation Pvt. Ltd.
- amongst others.
This Report Segments the Online Presentation Software Market into:
By Component
- Software And Services
By Deployment
- On-Premise And Cloud Based
By Software Share
- Web Based And App-Based
By Role Share
- Marketers
- Finance
- Sales Team
- Human Resources
- Event
- Training And Development
By Device
- Smartphones
- Tablet
- PC and Others
By Subscription
- Monthly And Annual
By End User
- Enterprises
- Students
- Educators And Bloggers
- Consultants
- NGOs
Global Online Presentation Software Market: Regional Segment Analysis
-
North America
- The U.S.
- Canada
- Europe
- France
- The UK
- Spain
- Germany
- Italy
- Rest of Europe
- Asia Pacific
- China
- Japan
- India
- South Korea
- Southeast Asia
- Rest of Asia Pacific
- Latin America
- Brazil
- Mexico
- Rest of Latin America
- Middle East & Africa
- GCC
- South Africa
- Rest of Middle East & Africa
Table Of Content
Methodology
FrequentlyAsked Questions
HappyClients

