Metal Cans and Glass Jars Market Size, Share Report, Analysis, Trends, Growth 2032

Metal Cans and Glass Jars Market - By Type (Metal Cans, and Glass Jars), By Application (Preserved Food, Pet Food, Milk Powder, and Others), and By Region - Global Industry Perspective, Comprehensive Analysis, and Forecast, 2024 - 2032
| Market Size in 2023 | Market Forecast in 2032 | CAGR (in %) | Base Year |
|---|---|---|---|
| USD 26.22 Billion | USD 32.18 Billion | 2.3% | 2023 |
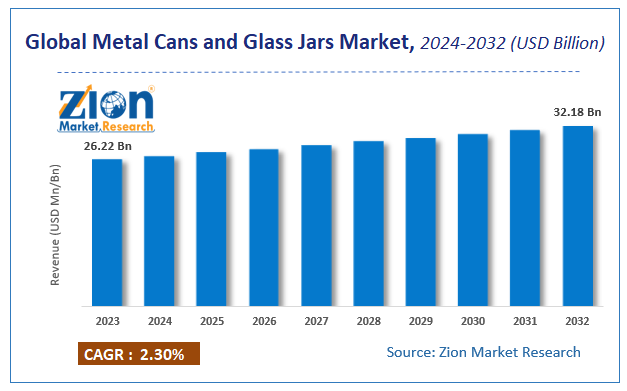
Metal Cans and Glass Jars Market: Size
The global Metal Cans and Glass Jars market size was worth around USD 26.22 billion in 2023 and is predicted to grow to around USD 32.18 billion by 2032 with a compound annual growth rate (CAGR) of roughly 2.3% between 2024 and 2032. The study provides historical data from 2018 to 2022 along with a forecast from 2024 to 2032 based on revenue (USD billion). The report covers a forecast and an analysis of the Metal Cans and Glass Jars market on a global and regional level.
 Request Free SampleRequest Free Sample
Global Metal Cans and Glass Jars Market: Overview
The major use of glass jars is seen in the food and beverage industry for the purpose of packaging materials. The main reason behind their enormous usage is the advantages they offer such as reusability, chemical stability, and sterility. Glass is used for the packing of a wide variety of items such as food, chemicals, alcoholic and non-alcoholic beverages, and pharmaceuticals. These glass bottles and jars are available in various shapes, sizes, and colors.
On the other hand, metal cans are also used for packaging purposes and are mostly preferred over glass. Similar to glass cans, these cans are also used for the packing of various items such as vegetables, fruits, soups, coffee, and meat. Metal cans have numerous advantages as compared to other materials used for packing; hence, these are mainly preferable option by manufacturers for packaging materials. Advantages such as long-term preservation of food, fully recyclable property, maintenance of the nutritional quality, and others are offered by metal cans. The major advantage of metals cans is that even after being repeatedly recycled, these cans show the same strength.
 Request Free SampleRequest Free Sample
Global Metal Cans and Glass Jars Market: Growth Factors
Factors such as rising demand for canned food owing to busy lifestyles, increasing awareness of waste segregation and recycling, high recycle rates are estimated to drive the metal cans and glass jars market globally. In addition, food items packed in metal cans and glass jars are very handy and easy to use. This, in turn, impacts the global metal cans and glass jars market growth in a positive way. Conversely, constantly changing prices of raw materials and available alternatives for packaging are some of the factors anticipated to hamper the growth of the global market in the near future.
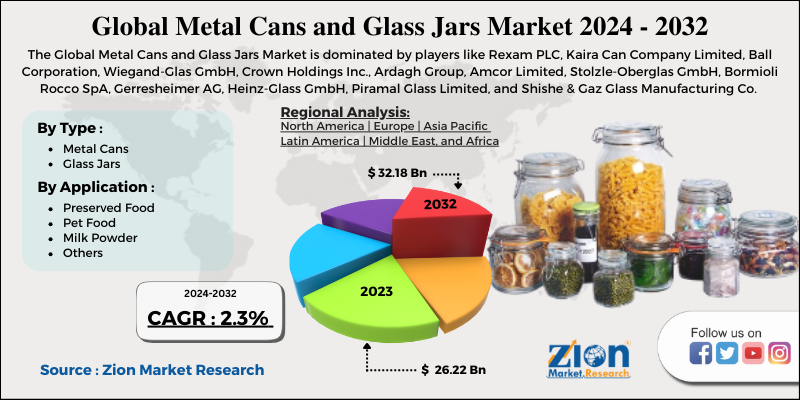
Global Metal Cans and Glass Jars Market: Segmentation
On the basis of type, the metal cans and glass jars market is segmented into glass jars and metal cans.
On the basis of glass jars and metal cans applications, the global metal cans and glass jars market is segmented as preserved food, pet food, milk powder, and others. The other segment is further sub-segmented as confectioneries, snacks, and others. Geographically, the global market is segmented as North America, Europe, Asia-Pacific, Middle East & Africa, and Latin America.
Metal Cans and Glass Jars Market: Report Scope
| Report Attributes | Report Details |
|---|---|
| Report Name | Metal Cans and Glass Jars Market |
| Market Size in 2023 | USD 26.22 Billion |
| Market Forecast in 2032 | USD 32.18 Billion |
| Growth Rate | CAGR of 2.3% |
| Number of Pages | 110 |
| Key Companies Covered | Rexam PLC, Kaira Can Company Limited, Ball Corporation, Wiegand-Glas GmbH, Crown Holdings Inc., Ardagh Group, Amcor Limited, Stolzle-Oberglas GmbH, Bormioli Rocco SpA, Gerresheimer AG, Heinz-Glass GmbH, Piramal Glass Limited, and Shishe & Gaz Glass Manufacturing Co. among others |
| Segments Covered | By Type, By Applications And By Region |
| Regions Covered | North America, Europe, Asia Pacific (APAC), Latin America, Middle East, and Africa (MEA) |
| Base Year | 2023 |
| Historical Year | 2018 to 2022 |
| Forecast Year | 2024 - 2032 |
| Customization Scope | Avail customized purchase options to meet your exact research needs. Request For Customization |
Global Metal Cans and Glass Jars Market: Regional Analysis
The Asia Pacific is anticipated to the largest and dominant player in the global metal cans and glass jars market owing to high demand from the food packaging industry in India and Iran. Moreover, high investments by industries in the development of products with different features in the glass jars and metal cans are also driving the market growth in this region.
Global Metal Cans and Glass Jars Market: Competitive Players
Some of the major players in the global metal cans and glass jars market are:
- Rexam PLC
- Kaira Can Company Limited
- Ball Corporation
- Wiegand-Glas GmbH
- Crown Holdings Inc.
- Ardagh Group
- Amcor Limited
- Stolzle-Oberglas GmbH
- Bormioli Rocco SpA
- Gerresheimer AG
- Heinz-Glass GmbH
- Piramal Glass Limited
- Shishe & Gaz Glass Manufacturing Co.
The Global Metal Cans and Glass Jars Market is segmented as follows:
By Type
- Metal Cans
- Glass Jars
By Application
- Preserved Food
- Pet Food
- Milk Powder
- Others
Global Metal Cans and Glass Jars Market: Regional Segment Analysis
- North America
- The U.S.
- Canada
- Europe
- France
- The UK
- Spain
- Germany
- Italy
- Rest of Europe
- Asia Pacific
- China
- Japan
- India
- South Korea
- Southeast Asia
- Rest of Asia Pacific
- Latin America
- Brazil
- Mexico
- Rest of Latin America
- Middle East & Africa
- GCC
- South Africa
- Rest of Middle East & Africa
Table Of Content
Methodology
FrequentlyAsked Questions
HappyClients

