Ink Additives Market Size, Share, Analysis, Trends, Growth, Forecasts, 2032

Ink Additives Market - By Application (Publishing, Packaging, and Printing), by Process (Flexography, Lithography, Digital, Gravure, and Others), By Technology (Water-based technology, Solvent-based technology, and Others), By Type (Foam Control Additives, Dispersing & Wetting Agents, Rheology Modifiers, and Slip/Rub Materials), and Region - Global Industry Perspective, Comprehensive Analysis, and Forecast, 2024 - 2032
| Market Size in 2023 | Market Forecast in 2032 | CAGR (in %) | Base Year |
|---|---|---|---|
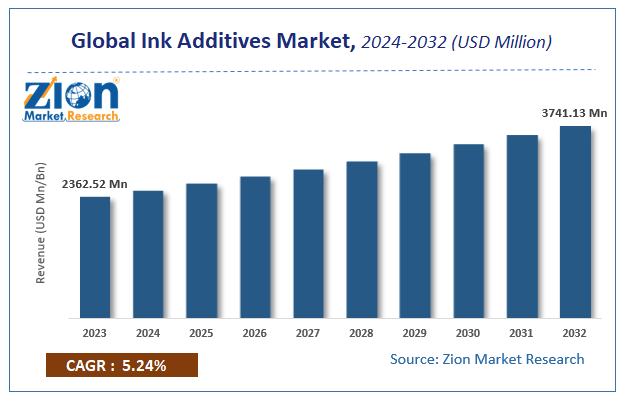
| USD 2362.52 Million | USD 3741.13 Million | 5.24% | 2023 |
Ink Additives Industry Perspective
According to a report from Zion Market Research, the global Ink Additives Market was valued at USD 2362.52 Million in 2023 and is projected to hit USD 3741.13 Million by 2032, with a compound annual growth rate (CAGR) of 5.24% during the forecast period 2024-2032. This report explores market strengths, weakness, opportunities, and threats. It also provides valuable insights into the market's growth drivers, challenges, and the future prospects that may emerge in the Ink Additives industry over the next decade.
Ink Additives Market: Overview
The Ink Additives Market refers to the industry focused on producing and supplying additives that enhance the performance of inks used in various applications, such as printing, packaging, and textiles. These additives include dispersants, defoamers, wetting agents, rheology modifiers, and slip & rub materials, all of which improve ink properties like flow, adhesion, drying time, and durability. The market is driven by the growing demand for high-quality, durable printing in industries such as packaging, publishing, and digital printing. Additionally, the rise of eco-friendly and water-based ink formulations, combined with increasing regulatory pressures for sustainability, is fueling innovation and growth in the ink additives market, particularly in regions like Asia-Pacific, North America, and Europe.
Ink additives are utilized in preparing of inks for incorporating particular features in improving the color, printability, appearance, finishing, and performance. Moreover inks comprise of additives like colorant, resin blender, and solvent and are added to the inks based on the requirement of imparting specific feature to the ink. Furthermore, growing need for environmental friendly inks for printing as well as odorless & harmless chemical compounds in inks will enhance the popularity of ink additives over the ensuing years.
Ink Additives Market: Growth Factors
Escalating need for packaging printing along with thriving ecommerce activities are few of the factors that will drive the market size in the coming years. Apart from this, rise in the production of ink additives with the view of its use in multiple applications will steer the expansion of the industry over the forecast timeline. Rise in the utilization of flexible packaging in food & beverages sector will create lucrative avenues for the ink additives business in the forthcoming years.
Furthermore, increase in the research activities and product innovations will pave the way for the growth of the ink additives market over the forecasting years. Nonetheless, rise in the digitization resulting in easy availability or access of e-books online at low prices will impede the growth of the business over the forthcoming years. Also, availability & purchase of e-tickets, sporting goods, electronic items, and toys will put brakes on the market over the forecast timespan.
The Ink Additives Market is experiencing growth driven by several key factors related to industry trends, technological advancements, and increasing demand for high-quality printing. Here are the primary growth factors:
-
Expansion of the Packaging Industry: The rise in demand for flexible packaging, labels, and other printed materials in sectors like food and beverages, cosmetics, and e-commerce is boosting the need for advanced ink additives. These additives improve print quality, durability, and color vibrancy, which are essential for high-end packaging.
-
Increased Adoption of Digital Printing: With the growing trend of digital printing in textiles, signage, and promotional materials, there is a rising demand for ink additives that enhance print sharpness, adhesion, and flexibility. The shift from traditional printing methods to digital processes is opening new opportunities for additive manufacturers.
-
Technological Advancements: Innovations in ink formulations, such as UV-cured inks and eco-friendly water-based inks, require specialized additives for improved performance. Technological advancements in printing methods, combined with the demand for high-resolution, long-lasting prints, are driving the growth of ink additives.
-
Sustainability and Environmental Regulations: Growing awareness of environmental issues and stricter regulations are pushing the development of eco-friendly inks and additives, particularly water-based and solvent-free solutions. Additives that reduce VOC (volatile organic compound) emissions and improve biodegradability are gaining traction, aligning with sustainability goals.
-
Growth in Emerging Markets: Rapid industrialization and urbanization in emerging markets like Asia-Pacific, Latin America, and Africa are fueling demand for packaging and printed materials. As these regions invest in their manufacturing and packaging industries, the ink additives market is seeing increased adoption to meet quality and environmental standards.
-
Customization and Specialized Printing Needs: The demand for personalized and customized packaging, particularly in industries like luxury goods and consumer electronics, is driving the need for innovative ink additives that enhance print performance, texture, and durability.
Overall, the expanding packaging industry, advancements in digital printing, environmental regulations, and growing demand from emerging markets are key factors propelling the ink additives market forward.
Ink Additives Market: Segmentation
The Ink Additives Market is segmented based on product type, application, formulation, and region.
By product type, it includes dispersants, defoamers, rheology modifiers, wetting agents, and slip & rub materials, each serving specific functions to enhance ink performance.
Application-wise, ink additives are used in printing for packaging, textiles, publications, and various types of printing processes such as flexographic, gravure, offset, and digital printing.
In terms of formulation, the market is divided into solvent-based, water-based, and UV-cured inks, catering to different printing needs.
Geographically, the market is segmented into North America, Europe, Asia-Pacific, and Latin America, with Asia-Pacific being the largest and fastest-growing region due to its booming packaging and textile industries. This segmentation helps in understanding the diverse demand across industries and regions.
Ink Additives Market: Report Scope
| Report Attributes | Report Details |
|---|---|
| Report Name | Ink Additives Market |
| Market Size in 2023 | USD 2362.52 Million |
| Market Forecast in 2032 | USD 3741.13 Million |
| Growth Rate | CAGR of 5.24% |
| Number of Pages | 110 |
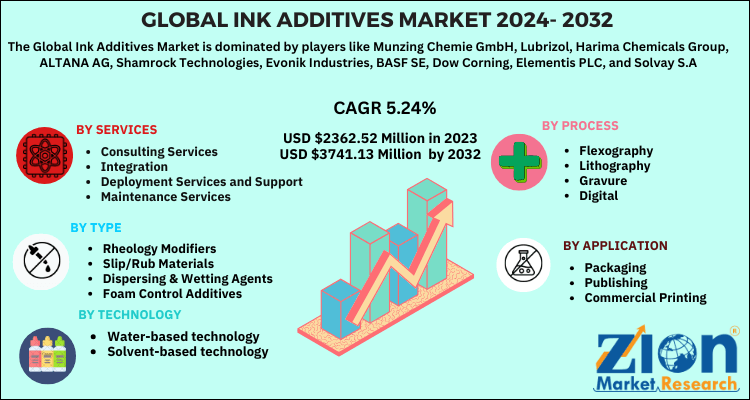
| Key Companies Covered | Munzing Chemie GmbH, Lubrizol, Harima Chemicals Group, ALTANA AG, Shamrock Technologies, Evonik Industries, BASF SE, Dow Corning, Elementis PLC, and Solvay S.A |
| Segments Covered | By Type, By Technology, By Process, By Application And By Region |
| Regions Covered | North America, Europe, Asia Pacific (APAC), Latin America, Middle East, and Africa (MEA) |
| Base Year | 2023 |
| Historical Year | 2018 to 2022 |
| Forecast Year | 2024 - 2032 |
| Customization Scope | Avail customized purchase options to meet your exact research needs. Request For Customization |
Ink Additives Market: Regional Insights
Asia Pacific Market Revenue To Reach Scalable Heights By 2032
The growth of the market in Asia Pacific region over the forecast timeline is due to massive use of flexographic printing inks in packaging of corrugated boxes, folding cartons, flexible packaging, metal cans, and labels in countries like China, Singapore, Malaysia, India, Thailand, and Japan.
Ink Additives Market: Competitive Space
Key players profiled in the report include
- Munzing Chemie GmbH
- Lubrizol
- Harima Chemicals Group
- ALTANA AG
- Shamrock Technologies
- Evonik Industries
- BASF SE
- Dow Corning
- Elementis PLC
- Solvay S.A.
- And Others
The global ink additives market is segmented as follows:
By type:
- Rheology Modifiers
- Slip/Rub Materials
- Dispersing & Wetting Agents
- Foam Control Additives
- Others (Driers, Chelating Agents, Antioxidants, pH Modifiers )
By technology
- Water-based technology
- Solvent-based technology
- Others
By process:
- Flexography
- Lithography
- Gravure
- Digital
- Others
By application
- Packaging
- Publishing
- Commercial Printing
By Region
- North America
- The U.S.
- Canada
- Europe
- France
- The UK
- Spain
- Germany
- Italy
- Rest of Europe
- Asia Pacific
- China
- Japan
- India
- South Korea
- Southeast Asia
- Rest of Asia Pacific
- Latin America
- Brazil
- Mexico
- Rest of Latin America
- Middle East & Africa
- GCC
- South Africa
- Rest of Middle East & Africa
Table Of Content
Methodology
FrequentlyAsked Questions
HappyClients

