Enterprise Mobility Management Market Size, Share, Growth Analysis, Forecast Report 2032

Enterprise Mobility Management Market - By Components (Solutions, And Services), By Deployment Type (On-Premises, And Cloud), By Organization Size (Large Enterprises, And Small & Medium Enterprises), By Vertical (Retail & E-Commerce, Government, Banking, Financial & Insurance Services, Manufacturing, Logistics, And Other Verticals), Global Industry Perspective, Comprehensive Analysis, and Forecast, 2024 - 2032
| Market Size in 2023 | Market Forecast in 2032 | CAGR (in %) | Base Year |
|---|---|---|---|
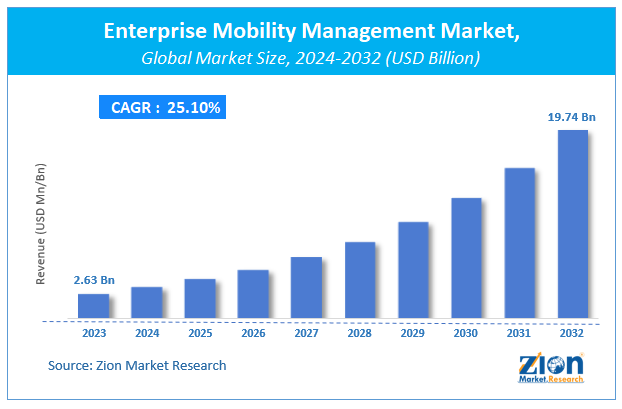
| USD 2.63 Billion | USD 19.74 Billion | 25.1% | 2023 |
Global Enterprise Mobility Management Market Insights
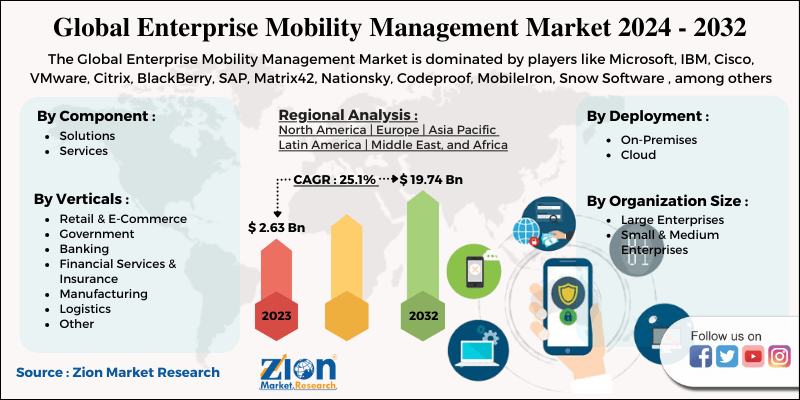
According to Zion Market Research, the global Global Enterprise Mobility Management Market was worth USD 2.63 Billion in 2023. The market is forecast to reach USD 19.74 Billion by 2032, growing at a compound annual growth rate (CAGR) of 25.1% during the forecast period 2024-2032.
The report offers a comprehensive analysis of the market, highlighting the factors that will determine growth, potential challenges, and opportunities that could emerge in the Global Enterprise Mobility Management Market industry over the next decade.
Market Overview
The enterprise mobility management is an enterprise’s ability to interact with customers, partners, employees, suppliers, assets, and products irrespective of any location. With the increase in number of smart phone & tablet users, there is increase in number of people who are looking for better utilization of these devices, particularly in workplace. Moreover, Enterprise mobility also provides enhanced employee efficiency, reduced costs, higher quality service security, and customer satisfaction.
Enterprise mobility has majorly helped in cost reduction and regulating access to company’s specific data. The demand for mobility in the current workforce is on the rise, particularly due to the impact of COVID-19 pandemic that is driving the shift to remote working. Adoption of mobility solutions is on the rise as these solutions give companies the option to control, update, and even wipe data off of devices from a distance. Also, now a days, the need for mobility management and the ability to detect and remediate vulnerabilities on remote endpoints is now a requirement rather than convenience.
COVID-19 Impact Analysis
The spread of this pandemic had seriously affected the manufacturers, supply chain and distribution channel of smart phones, tablets and laptops. The smart phones market will rise and so the mobility solutions market will rise as there is increasing work from home culture and the corporate world is allowing flexibility of time and work. As the pandemic has brought digital transformation to huge extent, the pandemic had been seen as positive impact on mobility solutions market.
Growth Factors
The increase in mobile workforce and adoption of (BYOD) Bring-Your-Own-Device programs, are the predominant factors that are driving the growth of the global enterprise mobility management market. Also, the current pandemic situation leading us to remote working, and the growing requisite of intellectual property protection are some of the factors responsible for driving the growth of the global enterprise mobility management market. To meet the untapped demand for the mobility needs of larger enterprises, (EMM) Enterprise Mobility Management consists of a larger set of functionalities that requires a complete set of features such as connecting from external networks into the cloud-based applications, remote server & organization, employee devices accessing corporate data, and remote work.
Furthermore, in addition to (MDM) Mobile Device Management, (EMM) Enterprise Mobility Management also encapsulates mobile application management, app wrapping & containerization, mobile content management, identity & access management, and also plays a vital role in securing & controlling cloud-based applications & computing and data storage. Owing to those abilities, the usage of EMM across several industries have been tremendously increased leading to boosting the growth of the global enterprise mobility management market in near future over the forecast period.
Deployment Segment Preview:
Based on Deployment Segment the Enterprise Mobility Management Market is segmented into, On-Premise and cloud. On-Premise segment is anticipated to bring in significant share during the forecast period owing to the major factors such as growing adoption of On-Premise based enterprise mobility management software by organization to secure their sensitive data of the organization which can be factors responsible for the increase of market growth in near future. On premises solutions are available for IT managers, who prefer them or who aren’t comfortable with device management in a shared-tenant cloud environment.
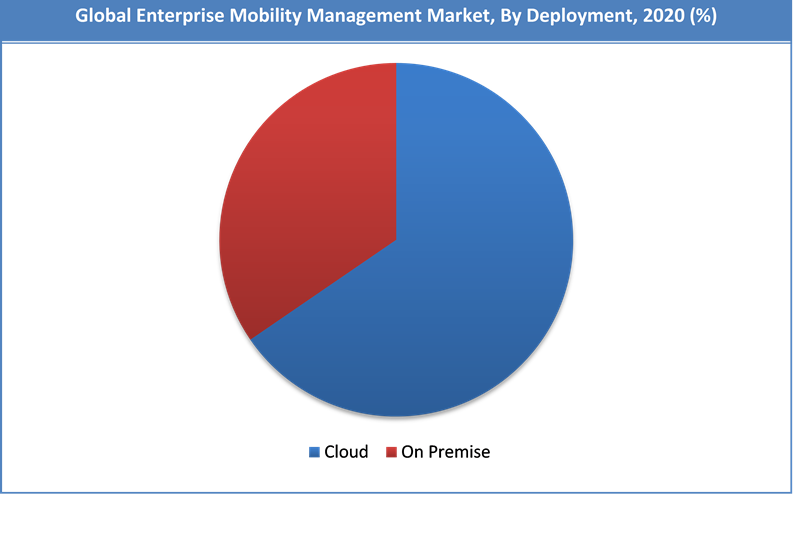 Request Free SampleThese solutions offer the same abilities as cloud-based ones, only with the added burden of installation and configuration, software management, scaling and performance checking and add-on high availability. However, the cloud segment is expected to grow at a highest rate during the forecast period, owing to rapid adoption of this services by various IT & telecom industry to increase their security. The advantage of cloud-based MDM/EMM is integration with the operating system, without necessarily needing a big agent or client to be installed on each device.
Verticals Segment Preview:
Based on Verticals Segment the Enterprise Mobility Management Market is segmented into, Retail & E-Commerce, Government, Banking, Financial Services & Insurance, Manufacturing, and Logistics.
Many industries had been deploying EMM at fast pace as it helps in evolving industry standards. Healthcare organizations and hospitals have to comply with various government compliance standards such as HIPAA, that help secure patients personally – identifiable information (PII) on mobile devices. EMM helps hospital organizations to comply with the standards while access and storing patient data on mobile devices.
Global Enterprise Mobility Management Market: Report Scope
| Report Attributes | Report Details |
|---|---|
| Report Name | Global Enterprise Mobility Management Market |
| Market Size in 2023 | USD 2.63 Billion |
| Market Forecast in 2032 | USD 19.74 Billion |
| Growth Rate | CAGR of 25.1% |
| Number of Pages | 174 |
| Key Companies Covered | Microsoft, IBM, Cisco, VMware, Citrix, BlackBerry, SAP, Matrix42, Nationsky, Codeproof, MobileIron, Snow Software , among others |
| Segments Covered | By components, By Deployment Type, By Organization Size, By Verticals, And By Region |
| Regions Covered | North America, Europe, Asia Pacific (APAC), Latin America, Middle East, and Africa (MEA) |
| Base Year | 2023 |
| Historical Year | 2018 to 2022 |
| Forecast Year | 2024 - 2032 |
| Customization Scope | Avail customized purchase options to meet your exact research needs. Request For Customization |
Regional Analysis Preview
Regionally, the global Artificial Intelligence in medical imaging is segmented into North America, Europe, Asia Pacific, and Rest of world. Among all, North America region is lead the market and dominate the market during the forecasting period. Moreover, Asia pacific is likely to grow with fasted CAGR rate during the forecasting period. However, ROW is expected to significant growth rate.
North America region includes US, Canada and Mexico. Owing to the well-established logistic, banking, telecommunication, healthcare, and IT sectors the North America region is anticipated to dominate the enterprise mobility management market. Moreover, high adoption rate of (BYOD) Bring-Your-Own-Device programs in North America coupled with development & growth of research & development activities and investments by government and private organizations is further stimulating the market growth.
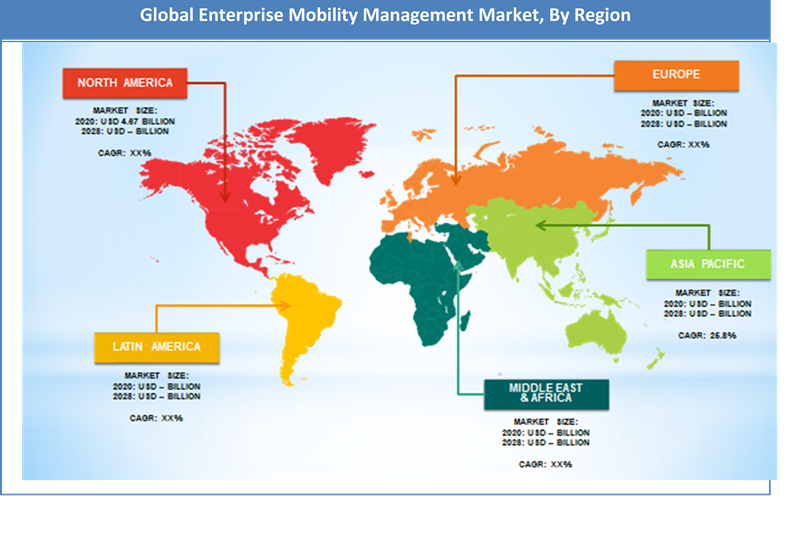 Request Free SampleAsia pacific is likely to grow with fasted CAGR rate during the forecast period for global enterprise mobility management market. The large number of small & medium enterprises and rising digital transformation can be the factors responsible for market growth in Asia Pacific region. Rapidly expanding end-use sectors in China, India, and Japan are expected to contribute major revenue in the Asia Pacific region over the forecast period.
Key Market Players & Competitive Landscape
Some of the major players in the market include,
- Microsoft
- IBM
- Cisco
- VMware
- Citrix
- BlackBerry
- SAP
- Matrix42
- Nationsky
- Codeproof
- MobileIron
- Snow Software
The Global Enterprise Mobility Management Market is segmented as follows:
By components
- Solutions
- Services
By Deployment Type
- On-Premises
- Cloud
By Organization Size
- Large Enterprises
- Small & Medium Enterprises
By Verticals
- Retail & E-Commerce
- Government
- Banking
- Financial Services & Insurance
- Manufacturing
- Logistics
- Other Verticals
By Region
- North America
- The U.S.
- Canada
- Europe
- France
- The UK
- Spain
- Germany
- Italy
- Rest of Europe
- Asia Pacific
- China
- Japan
- India
- South Korea
- Southeast Asia
- Rest of Asia Pacific
- Latin America
- Brazil
- Mexico
- Rest of Latin America
- Middle East & Africa
- GCC
- South Africa
- Rest of Middle East & Africa
Table Of Content
Methodology
FrequentlyAsked Questions
Enterprise Mobility Management Market size is set to expand from $ 2.63 Billion in 2023
Enterprise Mobility Management Market size is set to expand from $ 2.63 Billion in 2023 to $ 19.74 Billion by 2032, CAGR of around 25.1% from 2024 to 2032.
The global enterprise mobility management market is growing at a significant rate. The increase in bring-your-own-device movement, the current pandemic situation resulting in remote working, and the growing necessity of intellectual property protection are some of the predominant factors that are driving the growth of the global market.
North America is expected to dominate the global enterprise mobility management market in terms of market share over the forecast period.
Key players in the global enterprise mobility management market are focusing on product upgradations, new product development, mergers, and acquisitions. Some of the major players in the market include Microsoft, IBM, Cisco, VMware, Citrix, BlackBerry, SAP, Matrix42, Nationsky, Codeproof, MobileIron, and Snow Software among others.
HappyClients

