E-Waste Management Market Size, Share, Trends, Growth and Forecast 2032

E-Waste Management Market by Material Recovery (Plastic, Metals, Glass, PCBs, Ceramics, Wood, and Others), by Source Type (Household Appliances, Entertainment and Consumer Electronics, IT & Telecommunications, and Others): Global Industry Perspective, Comprehensive Analysis and Forecast, 2024-2032
| Market Size in 2023 | Market Forecast in 2032 | CAGR (in %) | Base Year |
|---|---|---|---|
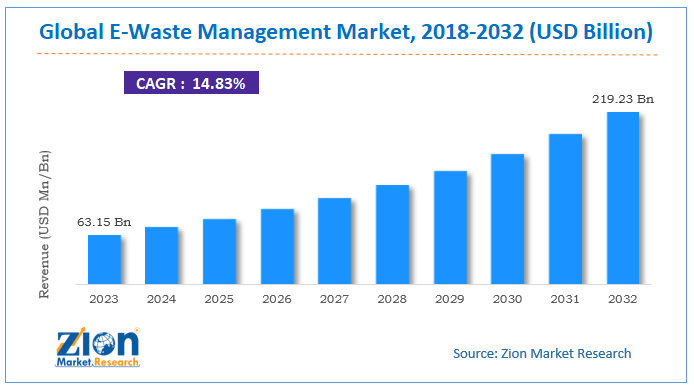
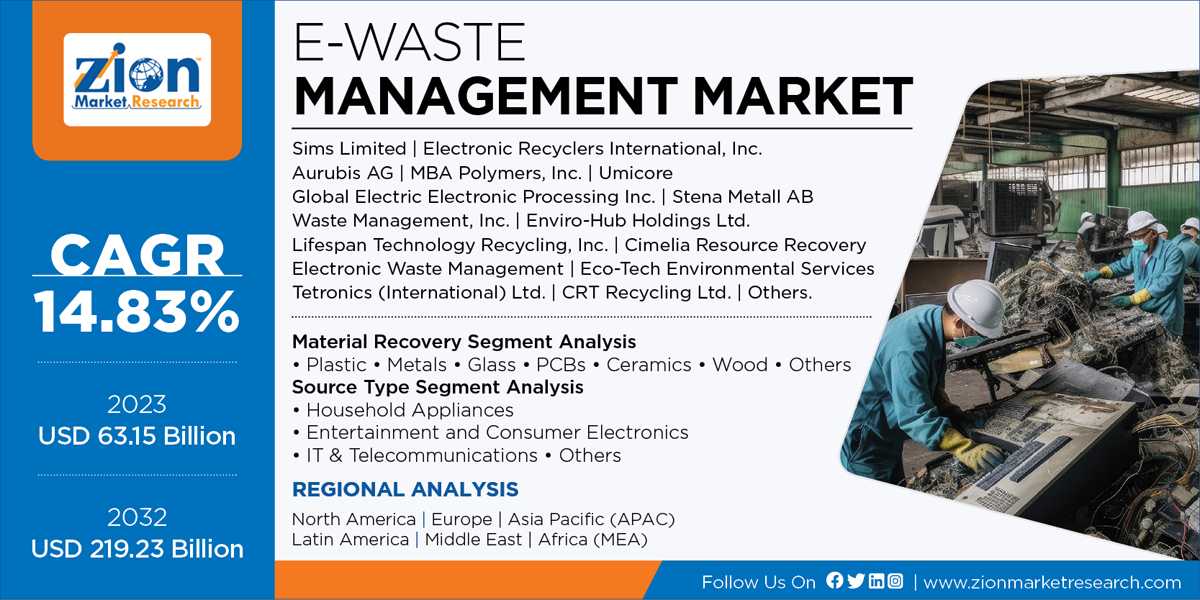
| USD 63.15 Billion | USD 219.23 Billion | 14.83% | 2023 |
E-Waste Management Industry Perspective:
The global E-Waste Management Market size was worth around USD 63.15 Billion in 2023 and is predicted to grow to around USD 219.23 Billion by 2032 with a compound annual growth rate (CAGR) of roughly 14.83% between 2024 and 2032.
 Request Free SampleRequest Free Sample
Key Insights
- As per the analysis shared by our research analyst, the e-waste management market is anticipated to grow at a CAGR of 14.83% during the forecast period.
- The global e-waste management market was estimated to be worth approximately USD 63.15 billion in 2023 and is projected to reach a value of USD 219.23 billion by 2032.
- The growth of the e-waste management market is being driven by the increasing generation of electronic waste from rising consumption of consumer electronics, rapid technological advancements, and shorter device lifecycles.
- Based on the material recovery, the plastic segment is growing at a high rate and is projected to dominate the market.
- On the basis of source type, the household appliances segment is projected to swipe the largest market share.
- By region, North America is expected to dominate the global market during the forecast period.
E-Waste Management Market Overview
E-waste or electronic waste is the waste material produced from rejected electronic devices and materials as well as components used in their manufacturing process. E-waste consists of mobile phones, televisions, computers, white goods such as washing machines, tablets, fridges, digital cameras, toys, toasters, dryers, home entertainment systems, stereo systems, kettles, and any household or business items with electrical or circuitry components with battery or power supply. E-waste has been rising exponentially due to the increased manufacturing of electronic devices across the world owing to increased preferences of people towards electronic gadgets and technology. Such factors are contributing to the e-waste management market growth over the forecast period.
The E-waste management market pertains to the structured management and disposal of electronic waste, encompassing discarded electrical and electronic devices. This market addresses the burgeoning issue of electronic waste, ensuring its environmentally responsible disposal, recycling, or refurbishment. With the rapid obsolescence of electronic devices and the global surge in electronic consumption, the demand for effective e-waste management is rising.
This market addresses ecological concerns, promotes recycling, and ensures the safe handling of hazardous materials found in electronic waste. It aligns with the global shift toward sustainable practices, environmental regulations, and the efficient use of resources.
E-Waste Management Market Growth Dynamics
E-waste management is experiencing the highest growth rate for waste streams in developed as well as developing countries. Decreasing lifespan of electrical and consumer electronic devices is responsible to generate large electronic waste, which is rapidly growing each year. As per the estimation of the United Nations initiative for E-Waste production, in 2012 the world generated around 50 million tons of e-waste, on an average 15 lbs each person globally. In the same year, the UN also stated that the UK produced 1.3 million tons of electronic waste. China produced 11.1 million tons of e-waste, followed by the United States accounting for 10 million tons. Rising adoption rate of advanced technology devices coupled with increasing demand for upgraded latest technologies is further expected to drive the industry growth in the coming years. E-waste management initiatives by various governments have been taken to decrease e-waste generated across the world. Industry players are also taking various measures to recycle e-waste to reduce environmental pollution and hazards. For instance, in June 2014, Dell introduced its first computer made from plastics obtained from recycled electronics.
The report covers forecast and analysis for the e-waste management market on a global and regional level. The study provides historical data from 2017 to 2023 along with a forecast from 2023 to 2032 based on revenue (USD Billion). The study includes drivers and restraints for the e-waste management market along with the impact they have on the demand over the forecast period. Additionally, the report includes the study of opportunities available in the e-waste management market on a global level.
Global E-Waste Management Market: Growth Factors
In order to give the users of this report a comprehensive view on the e-waste management market, we have included competitive landscape and analysis of Porter’s Five Forces model for the market. The study encompasses a market attractiveness analysis, wherein material recovery segment and source type segment are benchmarked based on their market size, growth rate, and general attractiveness.
- E-waste management offers opportunities in recycling, refurbishment, materials recovery, and data security services, with the potential for growth in the evolving e-waste market.
- The proliferation of electronic devices and the rapid turnover of tech gadgets fuel the generation of electronic waste, driving the demand for effective e-waste management solutions.
- Stringent environmental regulations and the enforcement of responsible e-waste disposal practices by governments and regulatory bodies are compelling organizations to adopt proper e-waste management.
- Transparent supply chains are becoming a key trend in e-waste management, ensuring that e-waste is handled responsibly at every stage.
- The refurbishment and reuse of electronic devices are emerging trends, reducing e-waste generation and promoting sustainable practices.
- Developing regions with growing electronic consumption offer untapped markets for e-waste management services.
 Request Free SampleRequest Free Sample
The report provides company market share analysis in order to give a broader overview of the key players in the market. In addition, the report also covers key strategic developments of the market including acquisitions & mergers, new technology launch, agreements, partnerships, collaborations & joint ventures, research & development, technology and regional expansion of major participants involved in the market on the global and regional basis. Moreover, the study covers price trend analysis, the product portfolio of various companies according to the region.
Global E-Waste Management Market: Segmentation
The study provides a decisive view of the e-waste management market by segmenting the market based on material recovery, source type, and regions. All the segments have been analyzed based on present and the future trends and the market is estimated from 2018 to 2024.
Based on material recovery, the e-waste management market is segmented into plastic, glass, metals, ceramics, PCBs, wood, and others. On the basis of source type, the market is segmented into household appliances, entertainment and consumer electronics, IT & telecommunications, and others. ?
Regional Analysis
North America held substantial revenue share of the global e-waste management market in 2023 and the region is anticipated to continue with its regional supremacy over the forecast period. The growth of this regional market is attributed to the increased number of equipment and devices which are discarded every year since consumers upgrade to the technologically advanced products. Moreover, rising government initiatives in the U.S. to recycle e-waste is anticipated to further drive industry growth in the region over the forecast period. Asia Pacific is predicted to provide significant opportunities for the e-waste management. The region is a manufacturing hub, growing per capita income, and rising middle-class population is contributing to increasing demand for consumer electrical and electronic goods in Asia Pacific. Such factors are expected to drive the e-waste management market growth in the Asia Pacific region over the forecast timeframe.
E-Waste Management Market: Report Scope
| Report Attributes | Report Details |
|---|---|
| Report Name | E-Waste Management Market Size Report |
| Market Size in 2023 | USD 63.15 Billion |
| Market Forecast in 2032 | USD 219.23 Billion |
| Growth Rate | CAGR of 14.83% |
| Number of Pages | 192 |
| Forecast Units | Value (USD Billion), and Volume (Units) |
| Key Companies Covered | Sims Limited, Electronic Recyclers International, Inc., Aurubis AG, MBA Polymers, Inc., Umicore, Global Electric Electronic Processing Inc., Stena Metall AB, Waste Management, Inc., Enviro-Hub Holdings Ltd., Lifespan Technology Recycling, Inc., Cimelia Resource Recovery, Electronic Waste Management, Eco-Tech Environmental Services, Tetronics (International) Ltd., CRT Recycling Ltd., and Others. |
| Segments Covered | By Material Type ,By Application, By Source , By Recycler Type, Type By end-user, and By region |
| Base Year | 2023 |
| Historical Year | 2018 to 2022 |
| Forecast Year | 2024 - 2032 |
| Customization Scope | Avail customized purchase options to meet your exact research needs. Request For Customization |
E-Waste Management Market Players
- Sims Limited
- Electronic Recyclers International, Inc.
- Aurubis AG
- MBA Polymers, Inc.
- Umicore
- Global Electric Electronic Processing Inc.
- Stena Metall AB
- Waste Management, Inc.
- Enviro-Hub Holdings Ltd.
- Lifespan Technology Recycling, Inc.
- Cimelia Resource Recovery
- Electronic Waste Management
- Eco-Tech Environmental Services
- Tetronics (International) Ltd.
- CRT Recycling Ltd.
This report segments the global e-waste management market as follows:
Global E-Waste Management Market: Material Recovery Segment Analysis
- Plastic
- Metals
- Glass
- PCBs
- Ceramics
- Wood
- Others
Global E-Waste Management Market: Source Type Segment Analysis
- Household Appliances
- Entertainment and Consumer Electronics
- IT & Telecommunications
- Others
Global E-Waste Management Market: Regional Segment Analysis
- North America
- The U.S.
- Europe
- UK
- France
- Germany
- Asia Pacific
- China
- Japan
- India
- Latin America
- Brazil
- Middle East and Africa
Table Of Content
Methodology
FrequentlyAsked Questions
HappyClients

