Carbonated Beverage Processing Equipment Market Size, Share, Trends, Growth 2032

Carbonated Beverage Processing Equipment Market By Beverages Type (Non-Alcoholic (Club Soda, Seltzer, Tonic Water, Sparkling Mineral Water, and Others) and Alcoholic Beverages (Sparkling Wine and Beer), By Equipment Type (Filtration Equipment, Carbonation Equipment, Silos, Heat Exchangers, and Sugar Dissolvers), By Distribution Channel (Aftermarket Sales and OEM), and By Region - Global Industry Perspective, Comprehensive Analysis, and Forecast, 2024 - 2032-
| Market Size in 2023 | Market Forecast in 2032 | CAGR (in %) | Base Year |
|---|---|---|---|
| USD 311.5 Million | USD 504.35 Million | 5.5% | 2023 |
Carbonated Beverage Processing Equipment Market Insights
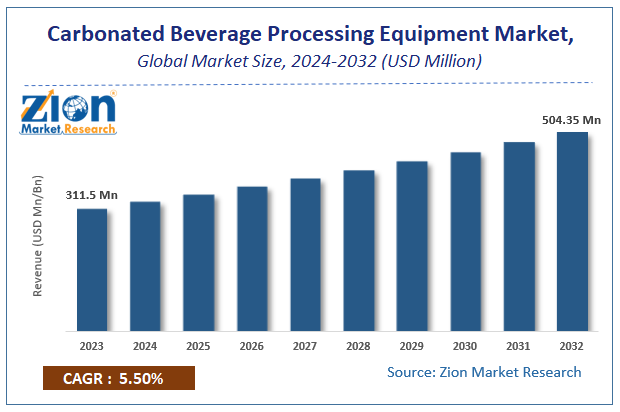
According to Zion Market Research, the global Carbonated Beverage Processing Equipment Market was worth USD 311.5 Million in 2023. The market is forecast to reach USD 504.35 Million by 2032, growing at a compound annual growth rate (CAGR) of 5.5% during the forecast period 2024-2032.
The report offers a comprehensive analysis of the market, highlighting the factors that will determine growth, potential challenges, and opportunities that could emerge in the Carbonated Beverage Processing Equipment industry over the next decade.
Carbonated Beverage Processing Equipment Market: Overview
Carbonated drinks are popular beverages that are consumed over 35 billion gallons every year. Additionally, soft drinks are popular globally and producing these beverages involves comprehensive processes & particular devices.
Additionally, beverages processing devices are used for processing & manufacturing of beverages synthesized from myriad formulations for preparing varied products like fruit juices, aerated drinks, processed water, and milk products. Moreover, the beverage processing device is usually designed & produced as per the specifications needed for processing various kinds of beverages. The product is approved by the U.S. FDA and many other regulatory authorities across the globe.
Carbonated Beverage Processing Equipment Market: Growth Factors
Large-scale demand for various functional drinks and rapid automation along with technological innovations increasing production will boost the market trends over the coming years. Additionally, high customer spending on drinks like wines, juice, bottled water, beer, juice, and soft drinks will boost the growth of the carbonated beverage processing equipment market over the forecast period.
Manufacturers have adopted a pre-emptive strategy for increasing their brand presence and fulfilling customer demand. In addition to this, capacity expansion by various players has enlarged the requirement for upgradation & deployment of the new device, thereby enlarging the scope of the business.
Carbonated Beverage Processing Equipment Market: Report Scope
| Report Attributes | Report Details |
|---|---|
| Report Name | Carbonated Beverage Processing Equipment Market |
| Market Size in 2023 | USD 311.5 Million |
| Market Forecast in 2032 | USD 504.35 Million |
| Growth Rate | CAGR of 5.5% |
| Number of Pages | 110 |
| Key Companies Covered | GEA Group Krones AG, Aktiengesellschaft, KHS GmbH, Bucher Industries, SPX Flow Inc., Tetra Laval Group, Alfa Laval AB, JBT Corporation, and Pentair plc |
| Segments Covered | By Equipment, By Beverages, By Distribution Channel And By Region |
| Regions Covered | North America, Europe, Asia Pacific (APAC), Latin America, Middle East, and Africa (MEA) |
| Base Year | 2023 |
| Historical Year | 2018 to 2022 |
| Forecast Year | 2024 - 2032 |
| Customization Scope | Avail customized purchase options to meet your exact research needs. Request For Customization |
Asia Pacific Market To Dominate Overall Carbonated Beverage Processing Equipment Market Share By 2032
The growth of the regional market over the forecast period is due to easy access to low-cost resources and skilled labor. In addition to this, firms in the region have expanded the capacities of the manufacturing units to bridge the demand-supply gap of the product in the Asia Pacific zone.
Carbonated Beverage Processing Equipment Market: Competitive Space
carbonated beverage processing equipment market profiles key players such as:
- GEA Group Krones AG
- Aktiengesellschaft
- KHS GmbH
- Bucher Industries
- SPX Flow Inc
- Tetra Laval Group
- Alfa Laval AB
- JBT Corporation
- Pentair plc
carbonated beverage processing equipment market is segmented as follows:
By Equipment Type
- Sugar Dissolver
- Carbonation Equipment
- Silos
- Heat Exchangers
- Filtration Equipment
By Beverages Type
- Alcoholic (Sparkling Wine, Beer)
- Non-alcoholic
- Sparkling Mineral Water
- Club Soda
- Seltzer
- Others
By Distribution Channel
- Aftermarket Sales
- OEM
By Region
- North America
- The U.S.
- Canada
- Europe
- France
- The UK
- Spain
- Germany
- Italy
- Rest of Europe
- Asia Pacific
- China
- Japan
- India
- South Korea
- Southeast Asia
- Rest of Asia Pacific
- Latin America
- Brazil
- Mexico
- Rest of Latin America
- Middle East & Africa
- GCC
- South Africa
- Rest of Middle East & Africa
Table Of Content
Methodology
FrequentlyAsked Questions
Machinery and instruments utilized in the manufacture of carbonated beverages, including sodas, sparkling water, and carbonated juices, are collectively referred to as carbonated beverage processing equipment. The froth that characterizes these beverages is a result of the presence of dissolved carbon dioxide (CO-2).
The global demand for effervescent beverages, such as soft drinks, sparkling water, and alcoholic beverages, continues to be high, despite the increasing awareness of health. The demand for sophisticated processing equipment is being driven by the growing popularity of functional carbonated beverages, such as flavored effervescent waters and energy drinks.
According to Zion Market Research, the global Carbonated Beverage Processing Equipment Market was worth USD 311.5 Million in 2023. The market is forecast to reach USD 504.35 Million by 2032.
What will be the CAGR value of the carbonated beverage processing equipment market during 2024-2032?
According to Zion Market Research, the global Carbonated Beverage Processing Equipment Market a compound annual growth rate (CAGR) of 5.5% during the forecast period 2024-2032.
The growth of the regional market over the forecast period is due to easy access to low-cost resources and skilled labor. In addition to this, firms in the region have expanded the capacities of the manufacturing units to bridge the demand-supply gap of the product in the Asia Pacific zone.
Key players involved in the carbonated beverage processing equipment industry include GEA Group Krones AG, Aktiengesellschaft, KHS GmbH, Bucher Industries, SPX Flow Inc., Tetra Laval Group, Alfa Laval AB, JBT Corporation, and Pentair plc.
HappyClients

