Automated Sortation System Market Size Report, Industry Share, Analysis, Growth, 2032

Automated Sortation System Market By System (Loop Sortation and Linear Sortation), By End Use Industry (Food & Beverages, Pharmaceutical, Transportation & Logistics, Retail, and Others): Global Industry Perspective, Comprehensive Analysis and Forecast, 2024 - 2032
| Market Size in 2023 | Market Forecast in 2032 | CAGR (in %) | Base Year |
|---|---|---|---|
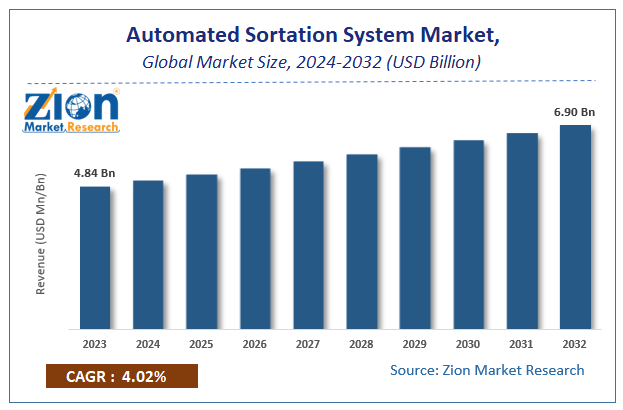
| USD 4.84 Billion | USD 6.90 Billion | 4.02% | 2023 |
Automated Sortation System Market Insights
Zion Market Research has published a report on the global Automated Sortation System Market, estimating its value at USD 4.84 Billion in 2023, with projections indicating that it will reach USD 6.90 Billion by 2032. The market is expected to expand at a compound annual growth rate (CAGR) of 4.02% over the forecast period 2024-2032. The report explores the factors fueling market growth, the hitches that could hamper this expansion, and the opportunities that may arise in the Automated Sortation System industry. Additionally, it offers a detailed analysis of how these elements will affect market demand dynamics and market performance throughout the forecast period.
The report analyzes the global automated sortation systems market’s drivers, restraints/challenges, and the effect they have on the demands during the projection period. In addition, the report explores emerging opportunities in the automated sortation systems industry.
Automated Sortation System Market is used in picking environments. These systems are used for identifying products over a conveyor system and diverting them to the desired destination. There are various types of automated sorters such as crossbelt sorters, push tray sorters, narrow belt sorters, and shoe sorters, among others.
Global Automated Sortation System Market: Growth Factors
The growing need for reduction in stock and ease in product handling is anticipated to augment the market over the next six years. Companies from numerous sectors are focusing on opting for various automated solutions to utilize their inventory in a proficient manner to provide just-in-time delivery services. As a result, the demand for automated sortation systems for proficient management of operations at distribution centers has increased.
The rising adoption of automated sortation systems in the logistics sector is anticipated to augment the market growth over the forecast period. Companies such as DHL International GmbH, FedEx Corporation, and United Parcel Service are focusing on using automated solutions to increase their throughput and augment their service offerings.
Global Automated Sortation System Market: Segmentation
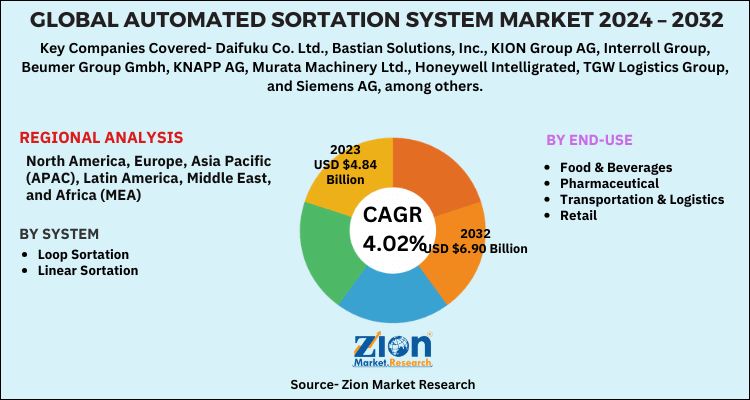
The automated sortation system market is segmented based on system, end-use industry, and region. The system segment is further divided into Loop Sortation and Linear Sortation. On the basis of end-use industry, the market is further divided into food & beverages, pharmaceutical, transportation & logistics, retail, and others.
Automated Sortation System Market: Report Scope
| Report Attributes | Report Details |
|---|---|
| Report Name | Automated Sortation System Market |
| Market Size in 2023 | USD 4.84 Billion |
| Market Forecast in 2032 | USD 6.90 Billion |
| Growth Rate | CAGR of 4.02% |
| Number of Pages | 110 |
| Key Companies Covered | Daifuku Co. Ltd., Bastian Solutions, Inc., KION Group AG, Interroll Group, Beumer Group Gmbh, KNAPP AG, Murata Machinery Ltd., Honeywell Intelligrated, TGW Logistics Group, and Siemens AG, among others |
| Segments Covered | By System, By End-Use And By Region |
| Regions Covered | North America, Europe, Asia Pacific (APAC), Latin America, Middle East, and Africa (MEA) |
| Base Year | 2023 |
| Historical Year | 2018 to 2022 |
| Forecast Year | 2024 - 2032 |
| Customization Scope | Avail customized purchase options to meet your exact research needs. Request For Customization |
Global Automated Sortation System Market: Regional Analysis
Based on regions, the global automated sortation system market is segmented into North America, Europe, Asia Pacific, Latin America, and the Middle East and Africa. The European region held a notable share in 2019. This is attributable to the presence of top companies such as Beumer Group Gmbh, KNAPP AG, and Siemens AG, among others. Moreover, the increasing usage of automated solutions in logistics sector is expected to generate huge demand for the market in this region.
The Asia Pacific region is one of the most lucrative regions for market players. This surge is due to the increasing adoption of online shopping in the region. Retailers are using automated solutions in their distribution facilities to provide on-time delivery of products. Additionally, the adoption of the Internet of Things (IoT) in various industrial and business operations is expected to open new avenues for the automated sortation system market over the coming years.
Global Automated Sortation System Market: Competitive Players
Some of the key players in the automated sortation system market are
- Daifuku Co. Ltd.
- Bastian Solutions. Inc.
- KION Group AG
- Interroll Group
- Beumer Group Gmbh
- KNAPP AG
- Murata Machinery Ltd.
- Honeywell Intelligrated
- TGW Logistics Group
- Siemens AG
- among others.
The global automated sortation system market is segmented as follows:
By System
- Loop Sortation
- Linear Sortation
By End-Use
- Food & Beverages
- Pharmaceutical
- Transportation & Logistics
- Retail
- And Others.
Global Automated Sortation System Market: Regional Segment Analysis
- North America
- The U.S.
- Canada
- Europe
- France
- The UK
- Spain
- Germany
- Italy
- Rest of Europe
- Asia Pacific
- China
- Japan
- India
- South Korea
- Southeast Asia
- Rest of Asia Pacific
- Latin America
- Brazil
- Mexico
- Rest of Latin America
- Middle East & Africa
- GCC
- South Africa
- Rest of The Middle East & Africa
Table Of Content
Methodology
FrequentlyAsked Questions
Logistics and distribution centers employ automated sortation systems to efficiently and accurately sort and route commodities. Automated machinery, conveyor belts, sensors, and computer software categorize and direct shipments to loading docks, trucks, and storage locations. This technology improves sorting speed, accuracy, and efficiency in warehouses, postal facilities, and e-commerce fulfillment centers.
Over the next six years, the market will rise due to the need to reduce stock and simplify product handling.
According to Zion market research report, the global automated sortation systems market size accrued earnings worth approximately 4.69 (USD Billion) in 2019 and is predicted to gain revenue of about 5.93 (USD Billion) by 2026, is set to record a CAGR of nearly 3.7% over the period from 2020 to 2026.
Europe had a large proportion in 2019. This is because prominent corporations like Beumer Group Gmbh, KNAPP AG, and Siemens AG are present. Additionally, the growing use of automated logistics solutions is likely to drive market demand in this region.
Some of the key players in the automated sortation system market are Daifuku Co. Ltd., Bastian Solutions, Inc., KION Group AG, Interroll Group, Beumer Group Gmbh, KNAPP AG, Murata Machinery Ltd., Honeywell Intelligrated, TGW Logistics Group, and Siemens AG, among others.
List of Contents
Market InsightsGrowth FactorsGlobalAutomated Sortation SystemSegmentationReport ScopeGlobalAutomated Sortation SystemMarket:Regional AnalysisGlobalAutomated Sortation SystemCompetitive PlayersThe global automated sortation system market is segmented as follows:GlobalAutomated Sortation SystemRegional Segment AnalysisHappyClients

