Agricultural Disinfectants Market Size, Share, Trends, Growth and Forecast 2032

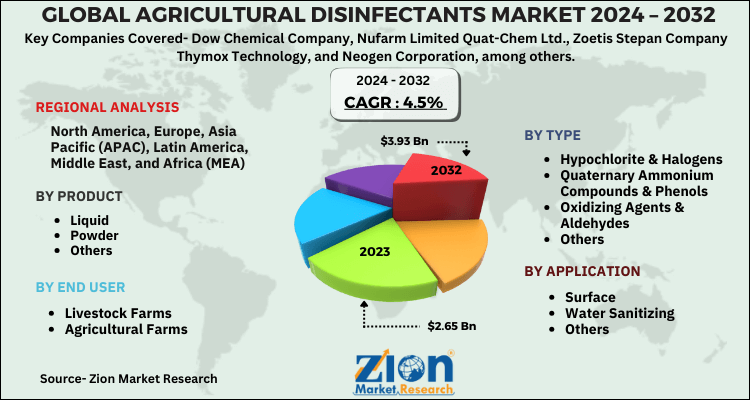
Agricultural Disinfectants Market By Product (Liquid, Powder and Others), By Type (Hypochlorite & Halogens, Quaternary Ammonium Compounds & Phenols, Oxidizing, Agents & Aldehydes, and Others), By Application (Surface, Water Sanitizing, and Others), By End Use (Livestock Farms, Agricultural Farms, and Others): Global Industry Perspective, Comprehensive Analysis and Forecast, 2024 - 2032
| Market Size in 2023 | Market Forecast in 2032 | CAGR (in %) | Base Year |
|---|---|---|---|
| USD 2.65 Billion | USD 3.93 Billion | 4.5% | 2023 |
Agricultural Disinfectants Market Insights
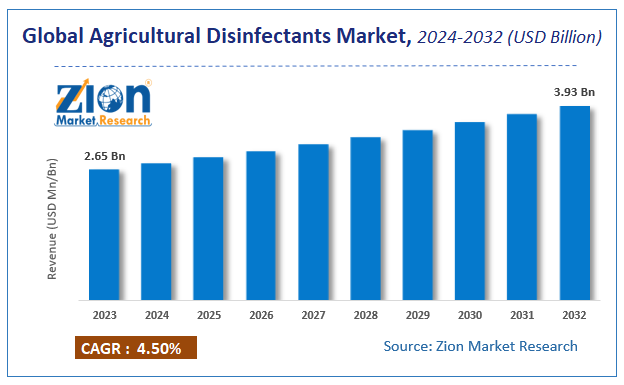
Zion Market Research has published a report on the global Agricultural Disinfectants Market, estimating its value at USD 2.65 Billion in 2023, with projections indicating that it will reach USD 3.93 Billion by 2032. The market is expected to expand at a compound annual growth rate (CAGR) of 4.5% over the forecast period 2024-2032.
The report explores the factors fueling market growth, the hitches that could hamper this expansion, and the opportunities that may arise in the Agricultural Disinfectants Market industry. Additionally, it offers a detailed analysis of how these elements will affect market demand dynamics and market performance throughout the forecast period.
Global Agricultural Disinfectants Market Size: Overview
Agricultural disinfectants comprise chemicals that are applied to crops and livestock in order to protect them against bacteria, viruses, and fungi among others. It eliminates the growth of harmful microorganisms. The disinfectants are used widely as they help to promote and elongate the health of both animals and plants.
Farmers use them on crops to prevent them from getting damaged and to improve irrigation facilities. These are also used on livestock as they are highly prone to infections which may lead to severe damage.
COVID-19 Impact Analysis
Due to the COVID-19 pandemic, the demand and supply of agricultural products were heavily affected. Lockdowns made the situation worse for the sector as a lot of products were wasted and could not be readily available for necessary usage. On the other hand, due to the non-availability of substitutes, a lot of farmers also relied on agricultural disinfectants in order to prevent crops and livestock from getting affected. These were also being used to disinfect the surfaces and areas amid the coronavirus as these proved effective against it.
Agricultural Disinfectants Market Size: Growth Factors
As new and sustainable crop cultivation techniques are coming up, the demand for agricultural disinfectants market size continues to rise up. For instance, protected cultivation is a technique adopted by farmers which requires the usage of agricultural disinfectants. The rising global population also requires escalated agricultural production which in turn derives the agricultural disinfectants market. As the pandemic continues, the need to sanitize and disinfect the areas will continue to prevail. Thus, agricultural disinfectants will be needed to disinfect the regions and eradicate harmful viruses and bacteria.
Agricultural Disinfectants Market: Report Scope
| Report Attributes | Report Details |
|---|---|
| Report Name | Agricultural Disinfectants Market |
| Market Size in 2023 | USD 2.65 Billion |
| Market Forecast in 2032 | USD 3.93 Billion |
| Growth Rate | CAGR of 4.5% |
| Number of Pages | 130 |
| Key Companies Covered | Dow Chemical Company, Nufarm Limited Quat-Chem Ltd., Zoetis Stepan Company Thymox Technology, and Neogen Corporation, among others |
| Segments Covered | By Product, By Type, By Application, By End Use and By Region |
| Regions Covered | North America, Europe, Asia Pacific (APAC), Latin America, Middle East, and Africa (MEA) |
| Base Year | 2023 |
| Historical Year | 2018 - 2022 |
| Forecast Year | 2024 - 2032 |
| Customization Scope | Avail customized purchase options to meet your exact research needs. Request For Customization |
Product Segment Analysis Preview
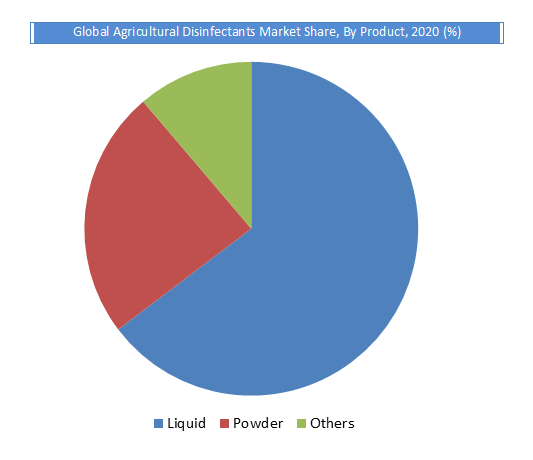
The liquid segment held a share of over 50% in 2020. Agricultural disinfectants as a product are available in different forms which include liquid, powder, and granular among others. However, it is mostly consumed in either powder or liquid form. These can be applied directly to a mass number of target groups. Both of these forms also take up a major portion of the segment.
End Use Segment Analysis Preview
The agricultural farm segment is projected to grow at a CAGR of around 5% from 2021 to 2032. Agricultural disinfectants are majorly consumed by agricultural farms and Livestock Farms. Agriculture farms use it to protect crops from harmful microorganisms, which helps the crops to grow in a secure environment. Livestock Farms use it on livestock that is prone to infections. Thus, using agricultural livestock assures the safety of livestock.
Agricultural Disinfectants Market: Regional Analysis Preview
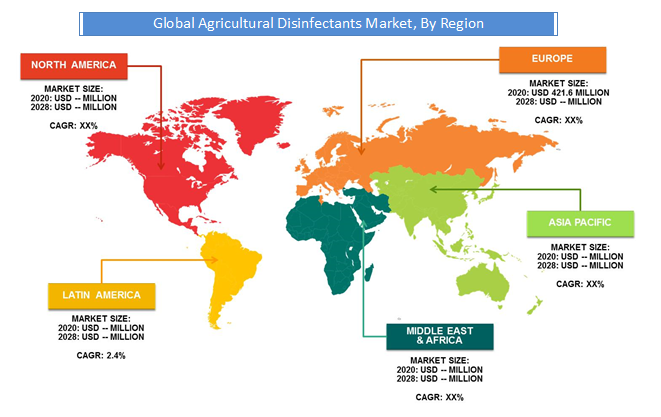
The North American region is projected to grow at a CAGR of around 3% over the forecast period. North America is the biggest disinfectant market in the world. Increased focus and production in the agriculture industry leads to the growth of the agricultural disinfectant market in the region. As new agricultural techniques such as protected cultivation continue to foster, it will also add up to the disinfectant market.
The Asia Pacific region is projected to grow at a CAGR of around 5% over the forecast period. The region is the biggest contributor to the agricultural disinfectants market. Agricultural production and livestock are the biggest factor for the region to invest in the agricultural disinfectants market. As more and more people continue to become aware of the industry, the scope for growth is huge in the region. Also, as agricultural production goes up, it will also add up to the growth of the market.
Agricultural Disinfectants Market: Key Players & Competitive Landscape
Some of the key players in the global agricultural disinfectants market are-
- Dow Chemical Company
- Nufarm Limited Quat-Chem Ltd.
- Zoetis Stepan Company Thymox Technology
- Neogen Corporation
- among others.
Market players are focusing on different market strategies such as mergers & acquisitions, collaborations, and partnerships to reinvent and strengthen their market reach in the global competitive market. For instance, The Dow Chemical Company has its strategies aligned with a purpose to be a part of a global sustainable business as it expands its footprint worldwide.
The global agricultural disinfectants market is segmented as follows:
Agricultural Disinfectants Market- By Product
- Liquid
- Powder
- Others
Agricultural Disinfectants Market- By Type
- Hypochlorite & Halogens
- Quaternary Ammonium Compounds & Phenols
- Oxidizing Agents & Aldehydes
- Others
By Application
- Surface
- Water Sanitizing
- Others
By End Use
- Livestock Farms
- Agricultural Farms
By Region
- North America
- The U.S.
- Canada
- Mexico
- Europe
- France
- The UK
- Spain
- Germany
- Italy
- Rest of Europe
- Asia Pacific
- China
- Japan
- India
- Australia
- South Korea
- Rest of Asia Pacific
- The Middle East & Africa
- Saudi Arabia
- UAE
- Egypt
- Kuwait
- South Africa
- Rest of the Middle East & Africa
- Latin America
- Brazil
- Argentina
- Rest of Latin America
Table Of Content
Methodology
FrequentlyAsked Questions
Agricultural Disinfectants Market market size valued at US$ 2.65 Billion in 2023
Agricultural Disinfectants Market market size valued at US$ 2.65 Billion in 2023, set to reach US$ 3.93 Billion by 2032 at a CAGR of about 4.5% from 2024 to 2032
Some of the key factors driving the global agricultural disinfectants market growth are rising global population which requires escalated agricultural production and new cultivation techniques both of which derives the agricultural disinfectants market.
The Asia Pacific region held a substantial share of the XX market in 2020. The region is the biggest contributor to the agricultural disinfectants market. The agricultural production and livestock are the biggest factor for the region to invest in the agricultural disinfectants market.
Some of the major companies operating in the global agricultural disinfectants market are the Dow Chemical Company, Nufarm Limited Quat-Chem Ltd., Zoetis Stepan Company Thymox Technology, and Neogen Corporation, among others.
List of Contents
Market InsightsGlobal Market Size: Overview COVID-19 Impact Analysis Market Size: Growth FactorsReport ScopeProduct Segment Analysis PreviewEnd Use Segment Analysis PreviewRegional Analysis Preview Key Players Competitive LandscapeThe global agricultural disinfectants market is segmented as follows:HappyClients

