Connected Agriculture Market Market Size, Share, Trends, Growth and Forecast 2032

Connected Agriculture Market By Application (Smart Logistics and Smart Irrigation), By Service(Bartering, Trading and Tendering), By Solution (Micro Lending Services, Micro Insurance Services, Mobile Payment Services, Mobile Information Services and Others): Global Industry Perspective, Comprehensive Analysis and Forecast, 2024 - 2032-
| Market Size in 2023 | Market Forecast in 2032 | CAGR (in %) | Base Year |
|---|---|---|---|
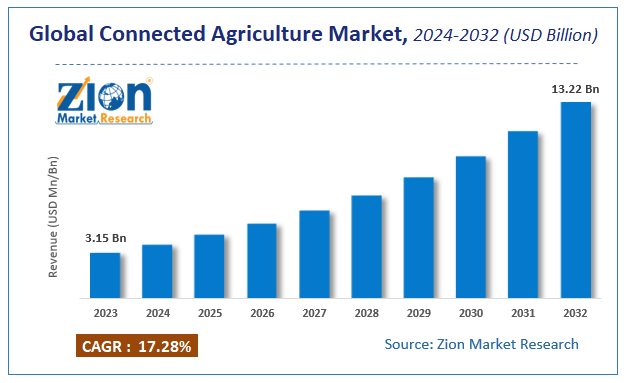
| USD 3.15 Billion | USD 13.22 Billion | 17.28% | 2023 |
Connected Agriculture Market Insights
Zion Market Research has published a report on the global Connected Agriculture Market, estimating its value at USD 3.15 Billion in 2023, with projections indicating that it will reach USD 13.22 Billion by 2032. The market is expected to expand at a compound annual growth rate (CAGR) of 17.28% over the forecast period 2024-2032.
The report explores the factors fueling market growth, the hitches that could hamper this expansion, and the opportunities that may arise in the Connected Agriculture Market industry. Additionally, it offers a detailed analysis of how these elements will affect market demand dynamics and market performance throughout the forecast period.
Market Overview
Connected agriculture is defined as the use of advanced technological solutions and services to improve, manage, and control the farming activities involved in pre-production, in-production, and post-production. Connected agriculture comprises 4 major steps, namely, data sensing, data communications, data storage, and data processing. The information generated from these steps helps various stakeholders, such as farmers, growers, livestock producers, farming cooperatives, agribusinesses, grape wine growers, seed companies, fertilizer companies, food and beverage companies, and governments, to make real-time decisions that help maximize their Return on Investment.
For Instance, December 2018 - IBM partnered with Hello Tractor (on-demand mobile platform providing tractors) to include several technologies, including the Watson Decision Platform for Agriculture, blockchain, the Internet of Things and IBM Cloud, to the app.
COVID-19 Impact Analysis
The precision farming market is likely to increase in the long term after the COVID-19 outbreak, as precision farming makes it possible to monitor the state of the crops while not being physically present through the usage of automation, minimizing the need to contact other people, which is crucial during these times. This farming is an approach where inputs are utilized in precise amounts to get increased average yields, compared to traditional cultivation techniques. However, in the short term, COVID-19 would affect the market and the growth of the market would be relatively slower in the first and second quarters of the year 2020 due to economic slowdown and inflation.
These practices save time and costs: reduce fertilizer and chemical application costs; reduce pollution through less use of chemicals. Also, they help in monitoring the soil and plant physiochemical conditions: by placing sensors to measure parameters such as electrical conductivity, nitrates, temperature, evapotranspiration, radiation, and leaf and soil moisture, so that the optimal conditions required for plant growth can be achieved. These factors help to obtain a greater output with limited labor force during this pandemic situation where there is a shortage of labor and thus would help in a regular supply of food, thereby ensuring food security.
Growth Factors
Rising demand for advanced farming solutions to improve the agricultural productivity is an important factor fostering the growth of market. Rising initiatives by the government to improve the overall scenario of agricultural sector is another important factor fostering the growth of the market. Upsurge in the demand for field management, inventory management and labor management solutions have further generated lucrative growth opportunities for the underground utility mapping market.
Connected Agriculture Market: Report Scope
| Report Attributes | Report Details |
|---|---|
| Report Name | Connected Agriculture Market |
| Market Size in 2023 | USD 3.15 Billion |
| Market Forecast in 2032 | USD 13.22 Billion |
| Growth Rate | CAGR of 17.28% |
| Number of Pages | 140 |
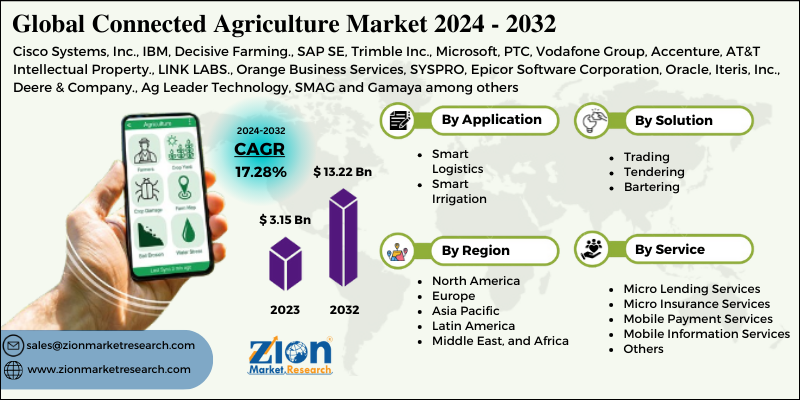
| Key Companies Covered | Cisco Systems, Inc., IBM, Decisive Farming., SAP SE, Trimble Inc., Microsoft, PTC, Vodafone Group, Accenture, AT&T Intellectual Property., LINK LABS., Orange Business Services, SYSPRO, Epicor Software Corporation, Oracle, Iteris, Inc., Deere & Company., Ag Leader Technology, SMAG and Gamaya among others |
| Segments Covered | By Application, By Service, By Solution and By Region |
| Regions Covered | North America, Europe, Asia Pacific (APAC), Latin America, Middle East, and Africa (MEA) |
| Base Year | 2023 |
| Historical Year | 2018 to 2022 |
| Forecast Year | 2024 - 2032 |
| Customization Scope | Avail customized purchase options to meet your exact research needs. Request For Customization |
Solution Segment Analysis Preview
On the basis of Solution, the connected agriculture market is segmented into network management, agriculture asset management, supervisory control and data acquisition, logistics and supply chain management and smart water management. Network Management segment is further bifurcated into remote monitoring, network bandwidth management, analytics and network and application security. Platforms segment is sub-segmented into device management, application enablement and connectivity management. Services segment is sub-segmented into consulting, integration and implementation and support and maintenance.
Application Segment Analysis Preview
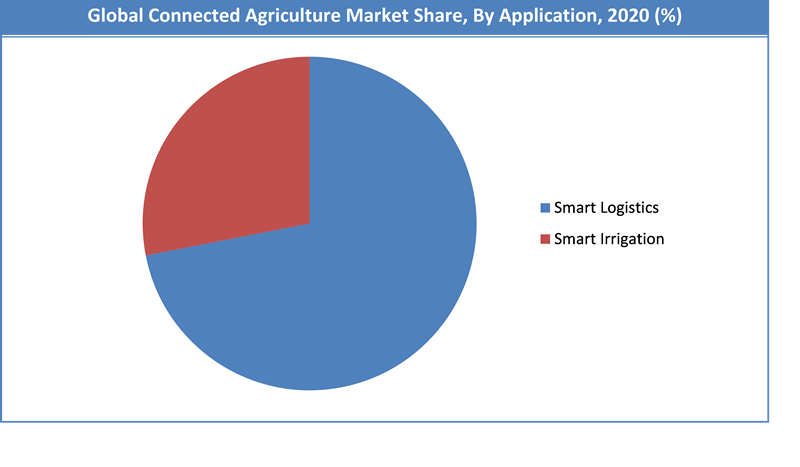
On the basis of application, the connected agriculture market is segmented into smart logistics and smart irrigation. Smart Logistics management segment is sub-segmented into field mapping, crop planning and yield monitoring, weather tracking and forecasting, farm labour management and equipment monitoring and maintenance. In-production planning and management segment is sub-segmented into water and irrigation management, breeding and feed management, crop scouting, production monitoring and maintenance, animal tracking and navigation and agro-finance and insurance management. Smart Irrigation management segment is sub-segmented into processing, inventory management, transportation and quality assurance and control.
Regional Analysis Preview
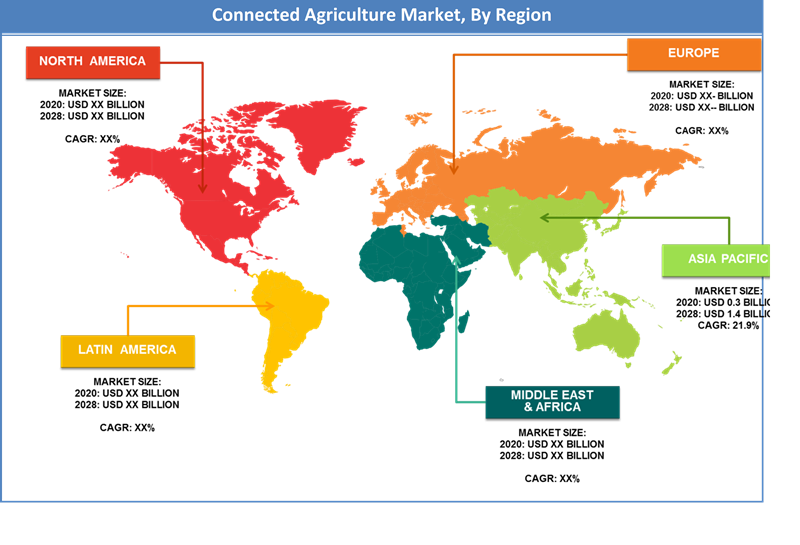
North America dominates the connected agriculture market and is set to continue to flourish its dominance during the forecast period as well. This is because of the increased adoption of connected agriculture by the small and marginal farmers. Large scale availability of advanced agricultural and farming equipment is fostering the market growth across countries in this region. However, it is Asia-Pacific that is set to score the highest CAGR for the forecast period owing to the growing investment in connected agriculture and implementation of cloud based solutions.
The countries covered in the connected agriculture market report are U.S., Canada and Mexico in North America, Germany, France, U.K., Netherlands, Switzerland, Belgium, Russia, Italy, Spain, Turkey, Rest of Europe in Europe, China, Japan, India, South Korea, Singapore, Malaysia, Australia, Thailand, Indonesia, Philippines, Rest of Asia-Pacific (APAC) in the Asia-Pacific (APAC), Saudi Arabia, U.A.E, Israel, Egypt, South Africa, Rest of Middle East and Africa (MEA) as a part of Middle East and Africa (MEA), Brazil, Argentina and Rest of South America as part of South America.
Key Market Players & Competitive Landscape
Some of key players in Connected Agriculture market are-
- Cisco Systems
- IBM
- Decisive Farming.
- SAP SE
- Trimble Inc.
- Microsoft
- PTC
- Vodafone Group
- Accenture
- AT&T Intellectual Property.
- LINK LABS.
- Orange Business Services
- SYSPRO
- Epicor Software Corporation
- Oracle
- Iteris
- Deere & Company.
- Ag Leader Technology
- SMAG and Gamaya among others.
Companies are focusing on developing new products and developing strategic partnerships to enhance their market share. For instance, December 2018 - IBM partnered with Hello Tractor (on-demand mobile platform providing tractors) to include several technologies, including the Watson Decision Platform for Agriculture, blockchain, the Internet of Things and IBM Cloud, to the app.
The Connected Agriculture market is segmented as follows:
By Application
- Smart Logistics
- Smart Irrigation
By Service
- Micro Lending Services
- Micro Insurance Services
- Mobile Payment Services
- Mobile Information Services
- Others
By Solution
- Trading
- Tendering
- Bartering
By Region
- North America
- The U.S.
- Canada
- Europe
- France
- The UK
- Spain
- Germany
- Italy
- Rest of Europe
- Asia Pacific
- China
- Japan
- India
- South Korea
- Southeast Asia
- Rest of Asia Pacific
- Latin America
- Brazil
- Mexico
- Rest of Latin America
- Middle East & Africa
- GCC
- South Africa
- Rest of Middle East & Africa
Table Of Content
Methodology
FrequentlyAsked Questions
Connected Agriculture Market market size valued at US$ 3.15 Billion in 2023
Connected Agriculture Market market size valued at US$ 3.15 Billion in 2023, set to reach US$ 13.22 Billion by 2032 at a CAGR of about 17.28% from 2024 to 2032.
Some of the key factors driving the Connected Agriculture market growth are Rising demand for advanced farming solutions to improve the agricultural productivity is an important factor fostering the growth of market. Rising initiatives by the government to improve the overall scenario of agricultural sector is another important factor fostering the growth of the market. Upsurge in the demand for field management, inventory management and labor management solutions have further generated lucrative growth opportunities for the underground utility mapping market.
North America dominates the connected agriculture market and is set to continue to flourish its dominance during the forecast period as well. This is because of the increased adoption of connected agriculture by the small and marginal farmers. Large scale availability of advanced agricultural and farming equipment is fostering the market growth across countries in this region. However, it is Asia-Pacific that is set to score the highest CAGR for the forecast period owing to the growing investment in connected agriculture and implementation of cloud based solutions.
Some of key players in Connected Agriculture market are Cisco Systems, Inc., IBM, Decisive Farming., SAP SE, Trimble Inc., Microsoft, PTC, Vodafone Group, Accenture., AT&T Intellectual Property., LINK LABS., Orange Business Services, SYSPRO, Epicor Software Corporation, Oracle, Iteris, Inc., Deere & Company., Ag Leader Technology, SMAG and Gamaya among others.
HappyClients

