Smart Agriculture Market Size, Share, Trends, Growth 2032

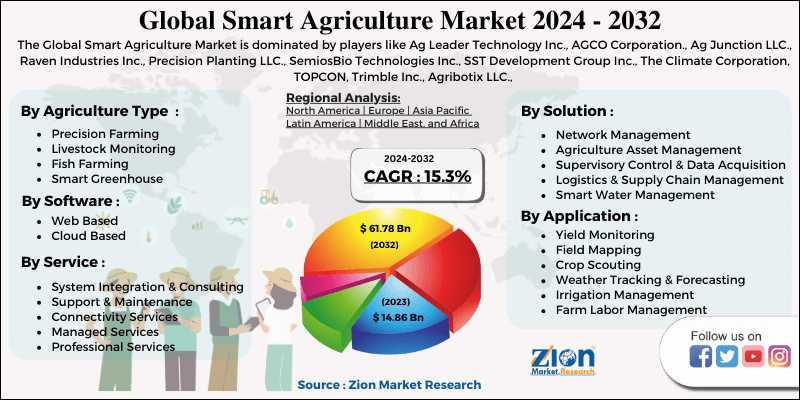
Smart Agriculture Market By Agriculture Type (Precision Farming, Livestock Monitoring, Fish Farming, Smart Greenhouse, and Others (Orchid, Forestry, and Horticulture); By Software (Web Based and Cloud Based); By Service (System Integration and Consulting, Support and Maintenance, Connectivity Services, Managed Services, and Professional Services); and By Solution (Network Management, Agriculture Asset Management, Supervisory Control and Data Acquisition, Logistics and Supply Chain Management, Smart Water Management, and Others); For Application (Yield Monitoring, Field Mapping, Crop Scouting, Weather Tracking and Forecasting, Irrigation Management, Farm Labor Management, Financial Management, Feeding Management, Milk Harvesting, Breeding Management, Fish Tracking and Fleet Navigation, Water Quality Management, HVAC Management, and Others) - Global Industry Analysis, Size, Share, Growth, Trends, and Forecast 2024-2032.
| Market Size in 2023 | Market Forecast in 2032 | CAGR (in %) | Base Year |
|---|---|---|---|
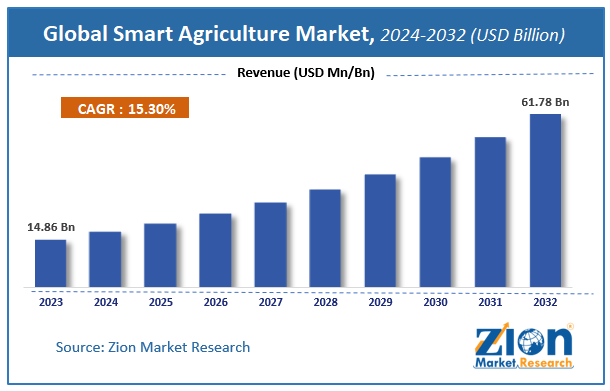
| USD 14.86 Billion | USD 61.78 Billion | 15.3% | 2023 |
Smart Agriculture Market Insights
According to Zion Market Research, the global Smart Agriculture Market was worth USD 14.86 Billion in 2023. The market is forecast to reach USD 61.78 Billion by 2032, growing at a compound annual growth rate (CAGR) of 15.3% during the forecast period 2024-2032.
The report offers a comprehensive analysis of the market, highlighting the factors that will determine growth, potential challenges, and opportunities that could emerge in the Smart Agriculture Market industry over the next decade.
Global Smart Agriculture Market Summary
Smart agriculture can be defined as a process of performing agricultural activities using advanced technologies. The advanced technologies used in the agriculture are segmented on the basis of type, software, service, solution, and application. Smart agriculture is an innovative way of carrying out farming activities by reducing human efforts and by making maximum utilization of the available resources. Precision farming includes automation systems and sensing devices.
These are used in monitoring and controlling the progress in the agricultural activities. The application and feasibility of smart agricultural devices depend upon the economic condition and size of the agricultural land. Advanced technological products that are used in the smart agriculture have a wide range of applications, which not only includes yield monitoring, field mapping, crop scouting but also includes irrigation management, milk harvesting, and many others.
Market Insights
- The report covers the forecast and analysis for the smart agriculture market on a global and regional level.
- The report includes the positive and the negative factors that are influencing the growth of the market.
- The revenue generated by the prominent industry players has been analyzed in the report.
- The market numbers have been calculated using top-down and the bottom-up approaches.
- The smart agriculture market has been analyzed using Porter’s Five Forces Analysis.
- The market is segmented on the basis of agriculture type, software type, service type, solution type, and application type, which in turn is bifurcated on a regional level as well.
- All the segments have been evaluated based on the present and the future trends.
- The report deals with in-depth quantitative and qualitative analyses of the smart agriculture market.
- The report includes the detailed company profiles of the prominent market players.
Drivers and Restraints
The major factors driving the growth of the market are increasing demand for food worldwide, the rise in the need of livestock health and performance monitoring, and increasing support of the government in the adoption of modern agriculture techniques. The growing population has increased the demand for food. According to United Nation, the most recent census signifies a human population of 7.3 billion and is projected to reach 9.7 billion by 2050.
In direct proportion to the growing population, the demand for the food is also expected to grow exponentially over the forecast period. Taking into consideration the rise in food demand, the farmers need to increase the crop production either by increasing the amount of agricultural land or by adopting advanced agricultural methods like precision farming. Most of the livestock are susceptible to infections and virus attacks, which is likely to increase the mortality rate of the livestock. In order to monitor the health and activity of the livestock, different types of RFID tags and readers and sensors are deployed.
Some of the factors limiting the growth of the smart agriculture market are the high cost of the devices used in smart agriculture and lack of awareness amongst the farmers. High cost incurred in the manufacturing of the smart agriculture devices, in turn, increases the price of the final product, which is likely to restrain the growth of the market over the forecast period.
Smart Agriculture Market Segmentation
Based on the agriculture type, precision farming registered the highest market share of over 49% in 2016. It is also expected to grow at the highest CAGR of around 13% over the forecast period. The growth in the precision farming is owing to its benefits. In precision farming, the amount of fertilizers and water used in yielding the crop is optimized with the help of sensing and the monitoring devices. In this type of farming, the precise amount of nutrients, pesticides, and water is made use for obtaining maximum crop yield.
On the basis of software, web-based software contributed the highest market share of around 58% in 2016. It is projected to grow at a CAGR of around 12% over the forecast period. Whereas, the cloud-based software is gaining traction owing to its increased applications. Due to which, the cloud-based software is anticipated to grow at the highest CAGR of around 14% over the forecast period. The cloud-based software provides data recovery in case of any mishap. Software updates are completely automated in cloud-based software, whereas it is manual in web-based software. The cloud-based software cuts the high cost of the hardware, which is required in the web-based software. Moreover, the cloud-based software provides flexibility in monitoring the agricultural activities from a remote location with the help of internet connection. Owing to these benefits, the popularity of the cloud-based software is increasing.
By service, system integration and consulting contributed the highest market share in 2016 of around 31.50%. It is estimated to grow at a CAGR of around 13.10% over the forecast period. However, managed services are projected to grow at a higher CAGR of around 14% over the forecast period. The demand for the system integration and consulting segment is increasing owing to the increase in the applications and adoption of advanced devices in agriculture.
By Application, yield monitoring segment accounted for the maximum market share in the global smart agriculture market in 2016. It is expected to grow at a CAGR of around 13.41% over the forecast period. Yield monitoring is one of the earliest practiced applications of smart agriculture. It was started in the early 1990s by the farmers in order to generate fertilizer and pH correction recommendations and is still being continued, thus increasing its popularity.
Smart Agriculture Market: Report Scope
| Report Attributes | Report Details |
|---|---|
| Report Name | Smart Agriculture Market |
| Market Size in 2023 | USD 14.86 Billion |
| Market Forecast in 2032 | USD 61.78 Billion |
| Growth Rate | CAGR of 15.3% |
| Number of Pages | 110 |
| Key Companies Covered | Ag Leader Technology Inc., AGCO Corporation., Ag Junction LLC., Raven Industries Inc., Precision Planting LLC., SemiosBio Technologies Inc., SST Development Group Inc., The Climate Corporation, TOPCON, Trimble Inc., Agribotix LLC., Auroras s.r.l., Deere & Company, DeLaval, GEA Group, and Grownetics Inc., amongst others. |
| Segments Covered | By Agriculture Type, By Software, By Service, By Solution, By Application And By Region |
| Regions Covered | North America, Europe, Asia Pacific (APAC), Latin America, Middle East, and Africa (MEA) |
| Base Year | 2023 |
| Historical Year | 2018 to 2022 |
| Forecast Year | 2024 - 2032 |
| Customization Scope | Avail customized purchase options to meet your exact research needs. Request For Customization |
Smart Agriculture Market Regional
Asia Pacific is expected to grow at the highest CAGR of 13.77% over the forecast period. Agriculture and associated business in the Asia Pacific region are likely to spur owing to the rising demand for food and other dairy products. Owing to the growing population in the countries such as India, China, and other Asian countries, the demand for food products has increased considerably. North America contributed the highest market share of 35% in 2016 and is expected to grow with a steady CAGR of around 12.77% over the forecast period. Europe is expected to grow at a CAGR of 13.42% over the forecast period, and it contributed a market share of 23.61% in 2016.
Smart Agriculture Market: Competitive Analysis
The global smart agriculture market is dominated by players like:
- Ag Leader Technology Inc
- AGCO Corporation
- Ag Junction LLC
- Raven Industries Inc
- Precision Planting LLC
- SemiosBio Technologies Inc
- SST Development Group Inc
- The Climate Corporation
- TOPCON
- Trimble Inc
- Agribotix LLC
- Auroras s.r.l.
- Deere & Company
- DeLaval, GEA Group
- Grownetics Inc
The global smart agriculture market is segmented as follows:
By Agriculture Type
- Precision Farming
- Livestock Monitoring
- Fish Farming
- Smart Greenhouse
- Others (Orchid, Forestry, and Horticulture)
By Software
- Web Based
- Cloud Based
By Service
- System Integration and Consulting
- Support and Maintenance
- Connectivity Services
- Managed Services
- Professional Services
By Solution
- Network Management
- Agriculture Asset Management
- Supervisory Control and Data Acquisition
- Logistics and Supply Chain Management
- Smart Water Management
- Others
By Application
- Yield Monitoring
- Field Mapping
- Crop Scouting
- Weather Tracking and Forecasting
- Irrigation Management
- Farm Labor Management
- Financial Management
- Feeding Management
- Milk Harvesting
- Breeding Management
- Fish Tracking and Fleet Navigation
- Water Quality Management
- HVAC Management
- Others
By Region
- North America
- The U.S.
- Canada
- Europe
- France
- The UK
- Spain
- Germany
- Italy
- Rest of Europe
- Asia Pacific
- China
- Japan
- India
- South Korea
- Southeast Asia
- Rest of Asia Pacific
- Latin America
- Brazil
- Mexico
- Rest of Latin America
- Middle East & Africa
- GCC
- South Africa
- Rest of Middle East & Africa
Table Of Content
Methodology
FrequentlyAsked Questions
Smart agriculture, sometimes referred to as precision agriculture or smart farming, is the application of data-driven methods and modern technologies to raise agricultural efficiency, sustainability, and output. In order to maximize resource utilization and improve agricultural yields, digital tools including sensors, IoT (Internet of Things), data analytics, artificial intelligence (AI), and robotics are being included into farming operations.
Driving the rise of the smart agriculture market from 2024 to 2032 are several main variables influencing its growth. Among these elements are technology developments, evolving farming methods, environmental issues, and financial constraints.
According to Zion Market Research, the Global Smart Agriculture Market was worth USD 14.86 Billion in 2023. The market is forecast to reach USD 61.78 Billion by 2032.
According to Zion Market Research, the Global Smart Agriculture Market a compound annual growth rate (CAGR) of 15.3% during the forecast period 2024-2032.
Owing to the growing population in the countries such as India, China, and other Asian countries, the demand for food products has increased considerably.
The report includes detailed profiles of the prominent market players that are trending in the market. The lists of the players that are compiled in the report are Ag Leader Technology Inc., AGCO Corporation., Ag Junction LLC., Raven Industries Inc., Precision Planting LLC., SemiosBio Technologies Inc., SST Development Group Inc., The Climate Corporation, TOPCON, Trimble Inc., Agribotix LLC., Auroras s.r.l., Deere & Company, DeLaval, GEA Group, and Grownetics Inc., amongst others.
HappyClients

