Wireless Access Infrastructure Market Size, Share, Trends, Growth 2032

Wireless Access Infrastructure Market Size By Component (Hardware, Services, and Software), By Services (Installation and Support & Maintenance Services), By Enterprise Size (SMEs and Large Enterprises), By Application (Automotive, Manufacturing, Energy and utility, Healthcare, Food and beverage, IT and telecommunication, and Banking and financial services), And By Region- Global Industry Perspective, Comprehensive Analysis, and Forecast, 2024 - 2032
| Market Size in 2023 | Market Forecast in 2032 | CAGR (in %) | Base Year |
|---|---|---|---|
| USD 167.93 Billion | USD 510.63 Billion | 11.8% | 2023 |
Global Wireless Access Infrastructure Market: Insights
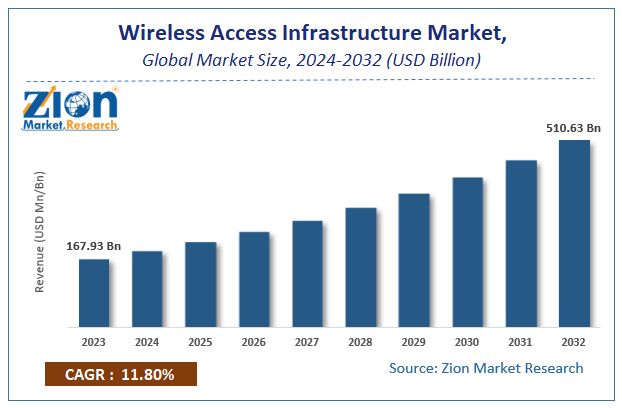
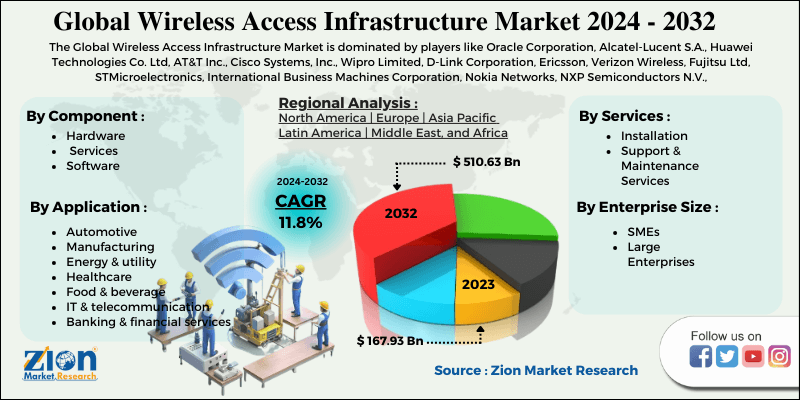
According to a report from Zion Market Research, the global Wireless Access Infrastructure Market was valued at USD 167.93 Billion in 2023 and is projected to hit USD 510.63 Billion by 2032, with a compound annual growth rate (CAGR) of 11.8% during the forecast period 2024-2032. This report explores market strengths, weakness, opportunities, and threats. It also provides valuable insights into the market's growth drivers, challenges, and the future prospects that may emerge in the Wireless Access Infrastructure Market industry over the next decade.
Global Wireless Access Infrastructure Market: Overview
Wireless access infrastructure represents hardware & software network parts facilitating improved network connection, operation management of firm network, and information transfer. Furthermore, escalating need for real-time insights in myriad sectors such as food & beverages, automotive, pharmaceutical, and production sectors will proliferate the expansion of wireless access infrastructure business over the forecast timeline. With growing industry 4.0 trends, the market for wireless access infrastructure is predicted to accelerate over the assessment period.
Global Wireless Access Infrastructure Market: Growth Drivers
Escalating acceptance of smart sensors & communication instruments synchronized with analytics tools will assist the firms produce huge data to examine along with product refinement. This will also help in fulfilling the unmet needs of customers, thereby driving market trends. Apart from this, massive industrial robot demand for enhancing power reliability & quality and reducing wastage of power will multiply the market size in the years ahead. In addition to this, with factory robots transferring information for message to message communications, the wireless access infrastructure industry is projected to make huge strides towards the path of optimum growth in the coming decade.
Key Insights
- As per the analysis shared by our research analyst, the global Wireless Access Infrastructure Market is estimated to grow annually at a CAGR of around 11.8% over the forecast period (2024-2032).
- In terms of revenue, the global Wireless Access Infrastructure Market size was valued at around USD 167.93 Billion in 2023 and is projected to reach USD 510.63 Billion by 2032.
- Based on the component, The hardware segment is the most dominant, capturing over 65% of the global wireless infrastructure market in 2024. This dominance is attributed to the essential role of physical components such as routers, antennas, and transceivers in establishing and maintaining wireless communication networks. The increasing demand for reliable and high-performance wireless infrastructure has driven the growth of this segment.
- Based on the services, Within the services category, support and maintenance services are the most dominant. As wireless infrastructure becomes more complex, the need for ongoing support to ensure optimal performance and minimal downtime has increased. These services are crucial for the continuous operation and reliability of wireless networks.
- Based on the enterprise size, Large enterprises constitute the most dominant segment in the wireless access infrastructure market. Their substantial resources and need for expansive, secure, and high-speed wireless networks drive significant investments in advanced infrastructure solutions. This enables them to support large-scale operations and a vast number of connected devices.
- Based on the application, The commercial sector is the leading application segment, accounting for more than 78% of the market share in 2024. This is due to the widespread adoption of wireless infrastructure in commercial settings to support activities such as video conferencing, cloud services, and online transactions, which require robust and reliable wireless connectivity.
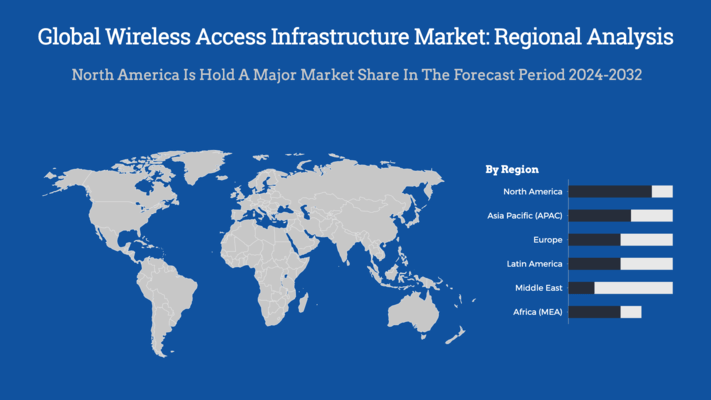
- Based on the region, North America holds the largest share in the wireless access infrastructure market, with over 35.2% in 2023. This dominance is driven by early adoption of advanced technologies, significant investments in 5G deployment, and a strong presence of key market players. The region's well-established telecommunications sector and high internet penetration further contribute to its leading position.
Global Wireless Access Infrastructure Market: Report Scope
| Report Attributes | Report Details |
|---|---|
| Report Name | Wireless Access Infrastructure Market |
| Market Size in 2023 | USD 167.93 Billion |
| Market Forecast in 2032 | USD 510.63 Billion |
| Growth Rate | CAGR of 11.8% |
| Number of Pages | 120 |
| Key Companies Covered | Oracle Corporation, Alcatel-Lucent S.A., Huawei Technologies Co. Ltd, AT&T Inc., Cisco Systems, Inc., Wipro Limited, D-Link Corporation, Ericsson, Verizon Wireless, Fujitsu Ltd, STMicroelectronics, International Business Machines Corporation, Nokia Networks, NXP Semiconductors N.V., Qualcomm Incorporated, and Intel Corporation. |
| Segments Covered | By Component, By Services, By Enterprise Size, By Application, and By Region |
| Regions Covered | North America, Europe, Asia Pacific (APAC), Latin America, Middle East, and Africa (MEA) |
| Base Year | 2023 |
| Historical Year | 2018 to 2022 |
| Forecast Year | 2024 - 2032 |
| Customization Scope | Avail customized purchase options to meet your exact research needs. Request For Customization |
Global Wireless Access Infrastructure Market: Segmentation
The study provides a decisive view of the Wireless access infrastructure market by segmenting the market based on by component, by services, by enterprise size, by application and by region. All the segments have been analyzed based on present and future trends and the market is estimated from 2024 to 2032.
By component segment analysis includes in hardware, services and software.
By services analysis includes installation and support & maintenance services.
By enterprise size segment analysis includes SMEs and large enterprises.
By application segment analysis includes automotive, manufacturing, energy and utility, healthcare, food and beverage, IT and telecommunication banking and financial services.
The regional segment includes the current and forecast demand for North America, Europe, Asia Pacific, Latin America, and the Middle East and Africa.
Global Wireless Access Infrastructure Market: Regional Analysis
The wireless access infrastructure market demonstrates distinct regional dynamics. Asia-Pacific leads in both market share and growth, driven by aggressive 5G rollouts in China, India, and South Korea, supported by government initiatives and rising smartphone penetration . North America, particularly the U.S., maintains a strong position with substantial investments in 5G deployment and advanced network technologies, catering to high consumer demand for reliable connectivity and IoT applications . Europe focuses on sustainable connectivity solutions and extensive 5G rollouts, with countries like Germany, the U.K., and France upgrading networks to support IoT, smart cities, and industrial automation . The Middle East and Africa are experiencing significant growth due to increasing mobile consumers and expanding tourism, while Latin America, led by Brazil, is witnessing rapid expansion in its wireless infrastructure market
Global Wireless Access Infrastructure Market: Key Players
Key players profiled in the study include:
- Oracle Corporation
- Alcatel-Lucent S.A.
- Huawei Technologies Co. Ltd
- AT&T Inc.
- Cisco Systems Inc.
- Wipro Limited
- D-Link Corporation
- Ericsson
- Verizon Wireless
- Fujitsu Ltd
- STMicroelectronics
- International Business Machines Corporation
- Nokia Networks
- NXP Semiconductors N.V.
- Qualcomm Incorporated
- Intel Corporation.
The global Wireless Access Infrastructure Market is segmented as follows:
By Component
- Hardware
- Services
- Software
By Services
- Installation
- Support & Maintenance Services
By Enterprise Size
- SMEs
- Large Enterprises
By Application
- Automotive
- Manufacturing
- Energy and utility
- Healthcare
- Food and beverage
- IT and telecommunication
- Banking and financial services
Global Wireless Access Infrastructure Market: Regional Segment Analysis
- North America
- The U.S.
- Canada
- Europe
- France
- The UK
- Spain
- Germany
- Italy
- Rest of Europe
- Asia Pacific
- China
- Japan
- India
- South Korea
- Southeast Asia
- Rest of Asia Pacific
- Latin America
- Brazil
- Mexico
- Rest of Latin America
- Middle East & Africa
- GCC
- South Africa
- Rest of Middle East & Africa
Table Of Content
Methodology
FrequentlyAsked Questions
The underlying hardware, software, and network components that let devices connect to the internet or other networks without physical cables—that is, wireless access infrastructure—are referred to here. Essential for mobile communication, IoT, and other wireless applications, Wi-Fi, cellular networks (4G, 5G), and Bluetooth help data be transmitted over the air.
Improved wireless infrastructure is in demand as telecom firms are deploying 5G to enable lower latency, greater data speeds, and more device connectivity.
According to a report from Zion Market Research, the global Wireless Access Infrastructure Market was valued at USD 167.93 Billion in 2023 and is projected to hit USD 510.63 Billion by 2032.
According to a report from Zion Market Research, the global Wireless Access Infrastructure Market a compound annual growth rate (CAGR) of 11.8% during the forecast period 2024-2032.
The expansion of industry in sub-continent over assessment period is owing to rise in the network connected equipment in the countries such as Canada and the U.S. Citing an instance, nearly 3 billion network equipment in 2017 were there in the sub-continent and it is slated to hit over 6 billion by 2022.
Oracle Corporation, Alcatel-Lucent S.A., Huawei Technologies Co. Ltd, AT&T Inc., Cisco Systems, Inc., Wipro Limited, D-Link Corporation, Ericsson, Verizon Wireless, Fujitsu Ltd, STMicroelectronics, International Business Machines Corporation, Nokia Networks, NXP Semiconductors N.V., Qualcomm Incorporated, and Intel Corporation.
HappyClients
Zion Market Research
Tel: +1 (302) 444-0166
USA/Canada Toll Free No.+1 (855) 465-4651
3rd Floor,
Mrunal Paradise, Opp Maharaja Hotel,
Pimple Gurav, Pune 411061,
Maharashtra, India
Phone No +91 7768 006 007, +91 7768 006 008
US OFFICE NO +1 (302) 444-0166
US/CAN TOLL FREE +1 (855) 465-4651
Email: sales@zionmarketresearch.com
We have secured system to process your transaction.
Our support available to help you 24 hours a day, five days a week.
Monday - Friday: 9AM - 6PM
Saturday - Sunday: Closed


