Surge Protection Devices Market Size, Share, Trends, Growth and Forecast 2032

Surge Protection Devices Market: By Type (Plug-In Devices, Hard Wired Devices, Line Cord Devices And Power Control Center) By Application (Commercial, Residential, And Industrial Applications), And Region: Global Industry Perspective, Comprehensive Analysis, Size, Share, Growth, Segment, Trends, And Forecast, 2024 - 2032
| Market Size in 2023 | Market Forecast in 2032 | CAGR (in %) | Base Year |
|---|---|---|---|
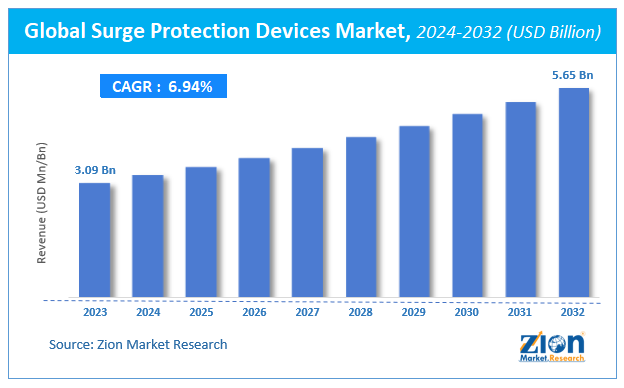
| USD 3.09 Billion | USD 5.65 Billion | 6.94% | 2023 |
Surge Protection Devices Market Insights
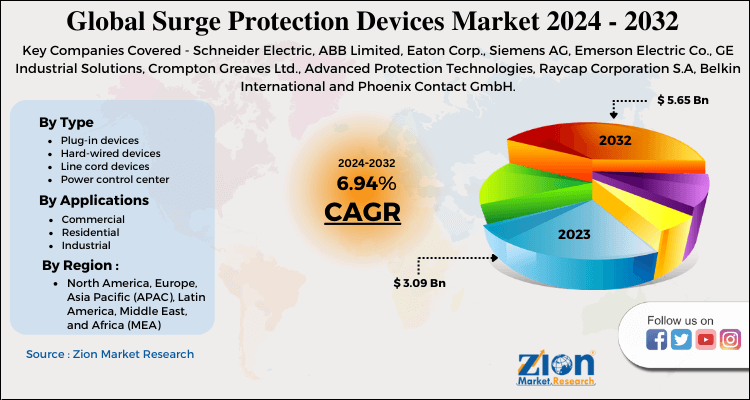
According to a report from Zion Market Research, the global Surge Protection Devices Market was valued at USD 3.09 Billion in 2023 and is projected to hit USD 5.65 Billion by 2032, with a compound annual growth rate (CAGR) of 6.94% during the forecast period 2024-2032.
This report explores market strengths, weakness, opportunities, and threats. It also provides valuable insights into the market's growth drivers, challenges, and the future prospects that may emerge in the Surge Protection Devices Market industry over the next decade.
Surge Protection Devices Market: Overview
Increasing power quality issues experienced by the equipment due to the huge electricity flow is anticipated to uplift the merchandise demand over the approaching years. Besides this, surge protection devices help in minimizing the upkeep costs of electronic devices. Furthermore, the swelling purchasing power of consumers in developing countries is anticipated to favorably affect surge protection devices market size. Seemingly, the product is proved effective in voltage spikes & surges, which may adversely impact the surge protection devices market growth within the years ahead. However, an increase in funding of research and development activities happening across the renewable energy sector is predicted to open new growth vistas for the surge protection devices industry within the near future, normalizing the impact of hindrances on the surge protection devices market, reports the surge protection devices market study.
The power surge is a spike in electric current and takes place due to a sudden interruption in the flow of electricity. Protection of electronic devices from power surges or spikes is called as surge protection. Surge protection devices allow various components to plug into a single power outlet. If power voltage increased more than the standard voltage or above the capacity of that device, it is likely to damage the electronic equipment. For residential and commercial application the standard voltage is marked around 120 volts and 230 volts respectively.
The increasing demand for advanced technological and sophisticated equipment such as LED televisions, personal computers, printers, and industrial control equipment such as microwaves, washing machines, and alarms are rising rapidly. Due to the high sensitivity of these devices, it is important to protect these devices from getting damaged and this, in turn, increases the demand for surge protection devices.
COVID-19 Impact Analysis
The COVID 19 has affected almost 220 countries and therefore the surge protection devices also. To combat the negative effects, nations opted for lockdowns that have unfavorably affected the surge protection devices. The pandemic results in several challenges to the sector; it's affected everywhere on the planet. Factors just like the supply chain, risk of uninterrupted production, distribution, lack of workforce employees, and much-decreased development activities have primarily affected the continued demand and supply. People aren't as active as earlier owing to the government's new guidelines. Considering future opportunities, MNC’s are investing more in surge protection devices due to the increasing demand from consumer electronics across the world.
Surge Protection Devices Market: Growth Factors
The global market is about to witness significant growth owing to the growing demand for cover systems for electronic devices, power quality issues, an increase in energy programs, and price escalation owing to frequent equipment failures. The devices allow a decrease in electrical equipment downtime and losses incurred owing to downtime. The rising need to safeguard expensive electrical equipment from unexpected electrical surges is predicted to boost the market growth. Acceptance of the latest trends and technology development are propelling the long-term future development of the Surge Protection Devices. Also, increasing efforts by market players to sustain within the market is another reason for the event of the worldwide surge protection devices.
Increasing usage of electronic devices is the major driving factor for the demand of surge protection devices market. Continuous technological development and high demand for electronic equipment in the residential and commercial application are expected to propel market growth over the forecast period. The global surge protection devices market is expected to witness moderate growth over the forecast period due to intense competition in electronic equipment manufacturers. Additionally, ongoing power quality problems have driven the demand for surge protection devices which in turn support the growth of this market.
Surge Protection Devices Market: Report Scope
| Report Attributes | Report Details |
|---|---|
| Report Name | Surge Protection Devices Market |
| Market Size in 2023 | USD 3.09 Billion |
| Market Forecast in 2032 | USD 5.65 Billion |
| Growth Rate | CAGR of 6.94% |
| Number of Pages | 160 |
| Key Companies Covered | Schneider Electric, ABB Limited, Eaton Corp., Siemens AG, Emerson Electric Co., GE Industrial Solutions, Crompton Greaves Ltd., Advanced Protection Technologies, Raycap Corporation S.A, Belkin International and Phoenix Contact GmbH |
| Segments Covered | By Type, By Application and By Region |
| Regions Covered | North America, Europe, Asia Pacific (APAC), Latin America, Middle East, and Africa (MEA) |
| Base Year | 2023 |
| Historical Year | 2018 to 2022 |
| Forecast Year | 2024 - 2032 |
| Customization Scope | Avail customized purchase options to meet your exact research needs. Request For Customization |
Type Segment Analysis Preview
Based on types, the main types available in this market are plug-in devices, power control centers, line cord devices, and hardwired devices. Among them, the demand for line cord devices is relatively higher and the trend is anticipated to remain so over the next few years, notes the surge protection devices market research report.
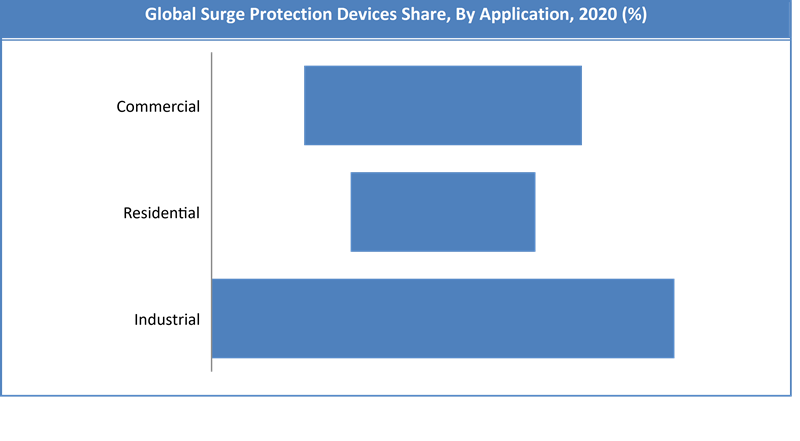
Application Segment Analysis Preview
The industrial application segment held the largest market size in 2019 and is expected to grow at a CAGR of 5% during the forecast period. Technological advancements have meaningly enhanced the prevailing manufacturing techniques. The industrial sector has widely supported the automation systems, use of heavy machinery, and high-end electronics to gain better operational efficiencies. Thus, the demand for surge protection devices has increased and is predicted to continue to grow over the forecast period.
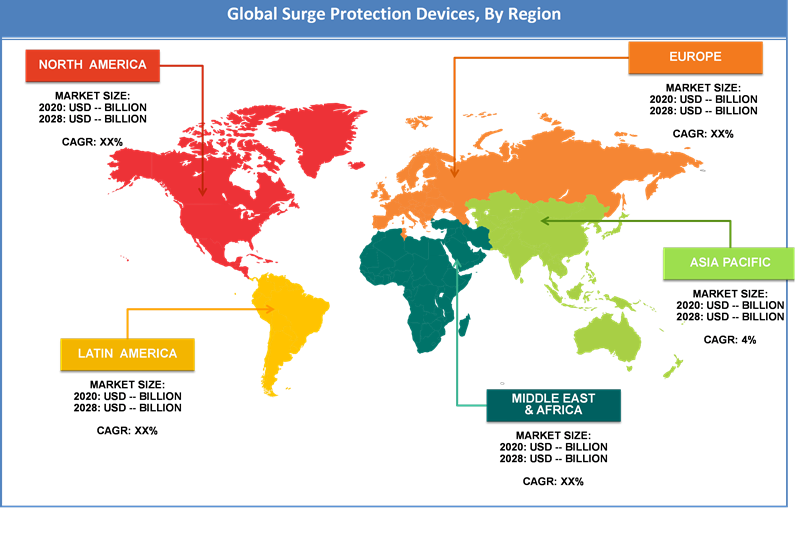
Surge Protection Devices Market: Regional Analysis Preview
Regionally, North America has been leading the worldwide Surge Protection Devices and is anticipated to continue on the dominant position within the years to return. This is due to the large-scale use of electrical & electronic devices, including washing machines, microwave ovens, and LED televisions is the key factor behind the dominance of the North America surge protection devices market. For the record, the North America surge protection devices market garnered revenue of nearly US$ 850 million in 2019. Apart from this, the Asia Pacific is estimated to be the fastest-growing region from 2021 to 2028.
Surge Protection Devices Market: Key Players & Competitive Landscape
Key players profiled in the report include -
- Schneider Electric
- ABB Limited
- Eaton Corp.
- Siemens AG
- Emerson Electric Co.
- GE Industrial Solutions
- Crompton Greaves Ltd.
- Advanced Protection Technologies
- Raycap Corporation S.A
- Belkin International and Phoenix Contact GmbH.
The Global Surge Protection Devices is segmented as follows:
By Type
- Plug-in devices
- Hard-wired devices
- Line cord devices
- Power control center
By Application
- Commercial
- Residential
- Industrial
By Region
- North America
- The U.S.
- Canada
- Europe
- France
- The UK
- Spain
- Germany
- Italy
- Rest of Europe
- Asia Pacific
- China
- Japan
- India
- South Korea
- Southeast Asia
- Rest of Asia Pacific
- Latin America
- Brazil
- Mexico
- Rest of Latin America
- Middle East & Africa
- GCC
- South Africa
- Rest of Middle East & Africa
Table Of Content
Methodology
FrequentlyAsked Questions
Surge Protection Devices Market size worth at USD 3.09 Billion in 2023
Surge Protection Devices Market size worth at USD 3.09 Billion in 2023 and projected to USD 5.65 Billion by 2032, with a CAGR of around 6.94% between 2024-2032.
Burgeoning power quality issues experienced by the electronic equipment owing to the massive electricity flow is anticipated to uplift the product demand over the coming years.
The North America is projected to account for the largest share in the surge protection devices during the forecast period.
Key players profiled in the report include Schneider Electric, ABB Limited, Eaton Corp., Siemens AG, Emerson Electric Co., GE Industrial Solutions, Crompton Greaves Ltd., Advanced Protection Technologies, Raycap Corporation S.A, Belkin International and Phoenix Contact GmbH.
HappyClients

