Stocks Market Demand, Size, Share & Forecast 2032

Stocks Market By Type (Common Stock, and Preferred Stock), and By Region: Global Industry Perspective, Comprehensive Analysis, and Forecast, 2024 - 2032
| Market Size in 2023 | Market Forecast in 2032 | CAGR (in %) | Base Year |
|---|---|---|---|
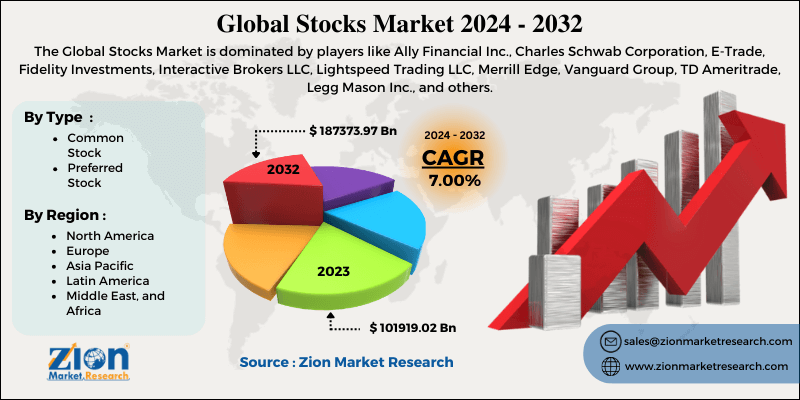
| USD 101919.02 Billion | USD 187373.97 Billion | 7.00% | 2023 |
Stocks Market: Industry Perspective
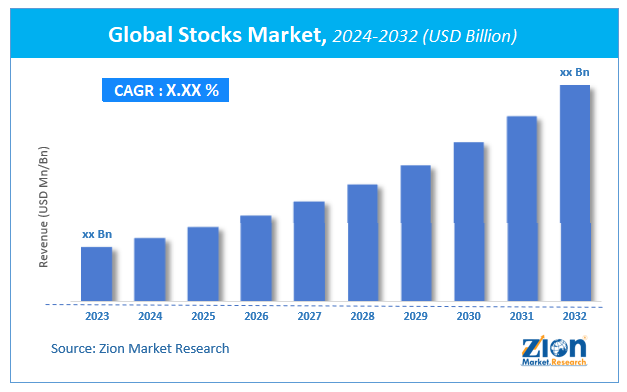
The global stocks market size was worth around USD 101919.02 billion in 2023 and is predicted to grow to around USD 187373.97 billion by 2032 with a compound annual growth rate (CAGR) of roughly 7.00% between 2024 and 2032. The report analyzes the global stocks market's drivers, restraints/challenges, and the effect they have on the demands during the projection period. In addition, the report explores emerging opportunities in the stocks industry.
Stocks Market: Overview
The report encompasses the forecast as well as an analysis of the stocks market on a global and regional level. The study displays historical data from 2018 to 2022 along with a forecast from 2024 to 2032 based on revenue (USD Billion). Additionally, the market growth drivers, opportunities, limitations, and trends are also included in the stocks market report.
We have included industry analysis models in our report and extensively demonstrated the key business strategies and competitive landscape of the stocks market in our study.
Key Insights from Primary Research
- As per our analyst, the stock market was valued at more than USD 101919.02 Billion in 2023.
- According to our primary respondents, the global stock market is expected to grow at a productive CAGR of around 7.00% over the forecast period.
- Based on the type of stocks, the global stocks market was headed by the common stocks. It accounted for more than 90% of shares of the market in 2023.
- Based on the regions, North America was the foremost market for stocks in 2023. It held above 46.2% share of the total market in 2023.
- As per the industry expertise, Asia Pacific will be the most prominent market for stocks over the upcoming years owing to the increasing penetration of investments in the mutual fund scheme and stock exchange sector.
Key Recommendations from Analysts
- As per our analysts, the stock market aids in raising money while debt markets are the major driving force of the market.
- Growing investments in mutual funds and other investment plans are projected to boost the market’s margin during the forthcoming years.
- China and India are the most attractive markets of stock in the Asia Pacific region and are expected to witness lucrative growth shortly due to the growth in small-cap stock in the region.
- As per industry expertise, the growing world economy and record-setting corporate earnings in developed and developing regions are expected to strengthen the global stock market by raising stock prices.
- Governments cutting down the interest rates and changes made in fiscal policy by countries influence consumer spending and business investment. These economic factors make businesses confident about investing in new infrastructure projects or expansion plans, in turn driving the stock market.
Our study also includes an analysis of Porter’s Five Forces framework for understanding the competitive strategies used by market competitors. It also encompasses PESTLE analysis and SWOT analysis.
The report also offers an in-depth analysis of the market share of each industry player and gives an outline of the market position of key players in the stocks market. Moreover, the study offers wide coverage of key strategic improvements witnessed in the market such as acquisitions & mergers, new product launches, agreements, partnerships, collaborations & joint ventures, R&D activities, and geographical expansion of key players of the stocks market.
Stocks Market: Segmentation Analysis
The study provides a decisive view of the stocks market by segmenting the stocks market based on type, and region. All the segments have been analyzed based on present and future trends and the market is estimated from 2024 to 2032. The regional segmentation includes the current and forecast demand for North America, Europe, Asia Pacific, Latin America, and the Middle East and Africa.
The shares of the listed pubic businesses are traded on the stock market. The primary market is where companies sell shares to the general public in the initial public offer (IPO) to raise capital. As a company grows, it goes through the various impediments of raising capital and funding for further expansions. The company’s owners can achieve success on the problem by borrowing money through investors, funders, or banks. Going public provides a company with capital that doesn’t have to return. This process acts as a new tool for the company. Instead of paying, such as the acquirement of another company or any business line, they can use their stock.
Countries worldwide are implementing major corporate tax cuts to regulate environments to encourage new investments. Further, governments cutting down the interest rates and changes made in fiscal policy by countries influence consumer spending and business investment. These economic factors make businesses confident about investing in new infrastructure projects or expansion plans, in turn driving the stock market.
Stocks Market: Report Scope
| Report Attributes | Report Details |
|---|---|
| Report Name | Stocks Market |
| Market Size in 2023 | USD 101919.02 Billion |
| Market Forecast in 2032 | USD 187373.97 Billion |
| Growth Rate | CAGR of 7.00% |
| Number of Pages | 230 |
| Key Companies Covered | Ally Financial Inc., Charles Schwab Corporation, E-Trade, Fidelity Investments, Interactive Brokers LLC, Lightspeed Trading LLC, Merrill Edge, Vanguard Group, TD Ameritrade, Legg Mason Inc., and others. |
| Segments Covered | By Type, and By Region |
| Regions Covered | North America, Europe, Asia Pacific (APAC), Latin America, The Middle East and Africa (MEA) |
| Base Year | 2023 |
| Historical Year | 2018 to 2022 |
| Forecast Year | 2024 - 2032 |
| Customization Scope | Avail customized purchase options to meet your exact research needs. Request For Customization |
Stocks Market: Competitive Analysis
The global stocks market is dominated by players like:
- Ally Financial Inc.
- Charles Schwab Corporation
- E-Trade
- Fidelity Investments
- Interactive Brokers LLC
- Lightspeed Trading LLC
- Merrill Edge
- Vanguard Group
- TD Ameritrade
- Legg Mason Inc.
This report segments the stocks market as follows:
Global Stocks Market: By Type Segment Analysis
- Common Stock
- Preferred Stock
Global Stocks Market: Regional Segment Analysis
- North America
- U.S.
- Canada
- Europe
- Germany
- France
- U.K.
- Italy
- Spain
- Rest of Europe
- Asia Pacific
- China
- Japan
- India
- South Korea
- South-East Asia
- Rest of Asia Pacific
- Latin America
- Brazil
- Mexico
- Rest of Latin America
- The Middle East and Africa
- GCC Countries
- South Africa
- Rest of Middle-East Africa
Table Of Content
Methodology
FrequentlyAsked Questions
A stock represents a share of ownership in a company. When you buy a stock, you become a part-owner of that company.
According to a study, the global stocks market size was worth around USD 101919.02 billion in 2023 and is expected to reach USD 187373.97 billion by 2032.
The global stocks market is expected to grow at a CAGR of 7.00% during the forecast period.
Europe is expected to dominate the stocks market over the forecast period.
Leading players in the global stocks market include Ally Financial Inc., Charles Schwab Corporation, E-Trade, Fidelity Investments, Interactive Brokers LLC, Lightspeed Trading LLC, Merrill Edge, Vanguard Group, TD Ameritrade, Legg Mason Inc., among others.
HappyClients

