Spend Analytics Market Size, Share, Trends, Growth 2032

Spend Analytics Market By Component (Software and Services), By Deployment (On-Premises, Cloud, and Hybrid) By Analytics (Descriptive, Diagnostic, Predictive, and Prescriptive), and By End-Use Industry (Retail, BFSI, IT & Telecom, Healthcare, Manufacturing, Energy & Utilities, Government Sector, and Others): Global Industry Perspective, Comprehensive Analysis, and Forecast, 2024-2032
| Market Size in 2023 | Market Forecast in 2032 | CAGR (in %) | Base Year |
|---|---|---|---|
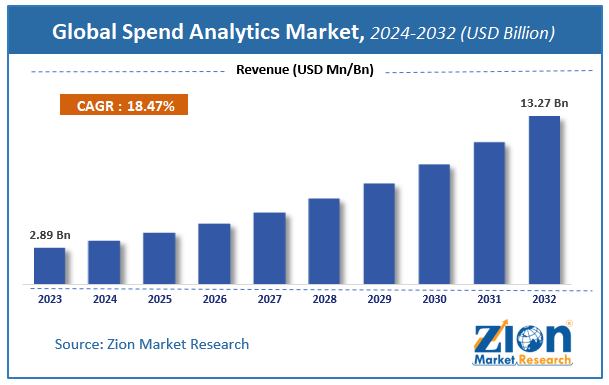
| USD 2.89 Billion | USD 13.27 Billion | 18.47% | 2023 |
Spend Analytics Market Insights
According to Zion Market Research, the global Spend Analytics Market was worth USD 2.89 Billion in 2023. The market is forecast to reach USD 13.27 Billion by 2032, growing at a compound annual growth rate (CAGR) of 18.47% during the forecast period 2024-2032.
The report offers a comprehensive analysis of the market, highlighting the factors that will determine growth, potential challenges, and opportunities that could emerge in the Spend Analytics Market industry over the next decade.
The report gives a transparent view of the spend analytics market. We have included a detailed competitive scenario and portfolio of the leading vendors operating in the spend analytics market. To understand the competitive landscape of the spend analytics market, an analysis of Porter’s Five Forces model for the spend analytics market has also been included. The study encompasses a market attractiveness analysis, wherein all the segments are benchmarked based on their market size, growth rate, and general attractiveness.
Spend Analytics Market: Growth Drivers
The increasing use of automation in the healthcare industry is paving the way for spend analytics market since the last few years. As healthcare costs are rising, organizations are opting for solutions that offer cost reduction and analysis of expenses that help in decision-making processes. Spend analytics analyze purchase orders, contracts, discounts, rebates, price variances for similar items from the same or different vendors over a specific timeframe. Furthermore, the U.S. health IT investments in 2018 were USD 8.6 billion as compared to USD 7.1 billion in 2017. Thus, it is anticipated that the demand for spend analytics solutions will grow in the upcoming years.
The global spend analytics market is expected to grow in the future, owing to the increasing demand for spend analytics solutions in the IT and telecom sector. Spend analytics helps telecom organizations to monitor their daily expenses in an efficient and effective manner. With the increasing number of smartphone users, telecom organizations are focusing on solutions that help them to manage and reduce costs to increase their profitability.
However, the lack of standardization can have an adverse effect on this market’s growth. The rising demand for spend analytics solutions in developing economies, such as China and India, is likely to open new avenues for the spend analytics market over the forecast time period.
Spend Analytics Market: Segmentation
The global spend analytics market is fragmented on the basis of deployment, component, analytics, and end-use industry.
The deployment segment comprises cloud, hybrid, and on-premises. The cloud segment is anticipated to hold a substantial share in the future, owing to its several benefits over other deployment methods.
By component, the market includes software and services.
On the basis of analytics, the spend analytics market descriptive, prescriptive, predictive, and diagnostic.
Based on end-use industry, the market includes healthcare, retail, IT and telecom, BFSI, manufacturing, energy and utilities, government sector, and others. The manufacturing sector will grow significantly over the forecast timeframe, owing to the increasing use of online transactions for procurement.
Spend Analytics Market: Report Scope
| Report Attributes | Report Details |
|---|---|
| Report Name | Spend Analytics Market |
| Market Size in 2023 | USD 2.89 Billion |
| Market Forecast in 2032 | USD 13.27 Billion |
| Growth Rate | CAGR of 18.47% |
| Number of Pages | 208 |
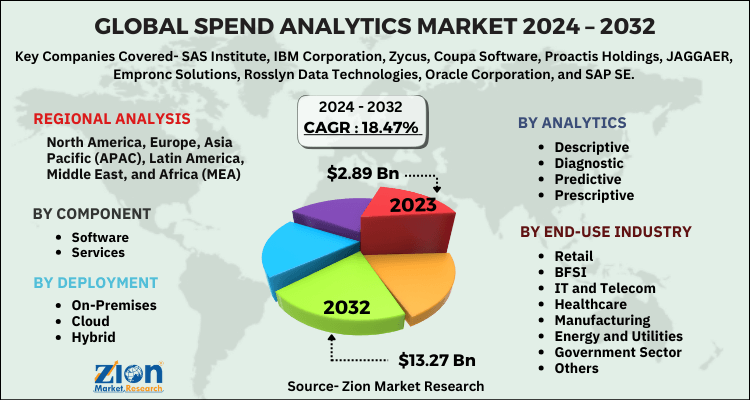
| Key Companies Covered | SAS Institute, IBM Corporation, Zycus, Coupa Software, Proactis Holdings, JAGGAER, Empronc Solutions, Rosslyn Data Technologies, Oracle Corporation, and SAP SE |
| Segments Covered | By deployment, By component, By analytics, By end-use industry and By Region |
| Regions Covered | North America, Europe, Asia Pacific (APAC), Latin America, Middle East, and Africa (MEA) |
| Base Year | 2023 |
| Historical Year | 2018 to 2022 |
| Forecast Year | 2024 - 2032 |
| Customization Scope | Avail customized purchase options to meet your exact research needs. Request For Customization |
Spend Analytics Market: Regional Analysis
The regional segmentation comprises the current and forecast demand for the Middle East and Africa, North America, Asia Pacific, Latin America, and Europe with further classification into the U.S., Canada, Mexico, UK, France, Germany, China, Japan, India, South Korea, Brazil, and Argentina.
North America is estimated to hold a substantial share of the global spend analytics market over the forecasted timespan. The U.S. is expected to make notable contributions to this regional market. Furthermore, the presence of major players, such as IBM Corporation, Oracle Corporation, Coupa Software, etc., in this region is expected to further the North American spend analytics market in the future. The Middle Eastern and African region will witness notable growth in the spend analytics market in the upcoming years, owing to the increasing adoption of technology by the retail sector.
Spend Analytics Market: Competitive Analysis
The global spend analytics market is dominated by players like:
- SAS Institute
- IBM Corporation
- Zycus
- Coupa Software
- Proactis Holdings
- JAGGAER
- Empronc Solutions
- Rosslyn Data Technologies
- Oracle Corporation
- SAP SE
This report segments the global spend analytics market into:
Global Spend Analytics Market: Deployment Analysis
- On-Premises
- Cloud
- Hybrid
Global Spend Analytics Market: Component Analysis
- Software
- Services
Global Spend Analytics Market: Analytics Analysis
- Descriptive
- Diagnostic
- Predictive
- Prescriptive
Global Spend Analytics Market: End-Use Industry Analysis
- Retail
- BFSI
- IT and Telecom
- Healthcare
- Manufacturing
- Energy and Utilities
- Government Sector
- Others
Global Spend Analytics Market: Regional Analysis
- North America
- The U.S.
- Europe
- UK
- France
- Germany
- Asia Pacific
- China
- Japan
- India
- Latin America
- Brazil
- Middle East and Africa
Table Of Content
Methodology
FrequentlyAsked Questions
The objective of spend analytics is to reduce procurement costs, enhance efficiency, and monitor financial practices within an organization by accumulating, cleansing, categorizing, and analyzing expenditure data. It entails an assessment of the organization's expenditures, the identity of its suppliers, and the amount of money dedicated to each supplier.
The demand for expenditure analytics solutions is being driven by the growing emphasis of organizations on cost reduction and procurement efficiency. Companies can optimize supplier relationships, negotiate more favorable contracts, and identify opportunities for cost savings through the use of spend analytics.
According to Zion Market Research, the global Spend Analytics Market was worth USD 2.89 Billion in 2023. The market is forecast to reach USD 13.27 Billion by 2032.
According to Zion Market Research, the global Spend Analytics Market a compound annual growth rate (CAGR) of 18.47% during the forecast period 2024-2032.
The regional segmentation comprises the current and forecast demand for the Middle East and Africa, North America, Asia Pacific, Latin America, and Europe with further classification into the U.S., Canada, Mexico, UK, France, Germany, China, Japan, India, South Korea, Brazil, and Argentina.
Some major players operating in the global spend analytics market include SAS Institute, IBM Corporation, Zycus, Coupa Software, Proactis Holdings, JAGGAER, Empronc Solutions, Rosslyn Data Technologies, Oracle Corporation, and SAP SE.
HappyClients

