Smart Office Market Size & Share Report, Growth, Trends, 2032

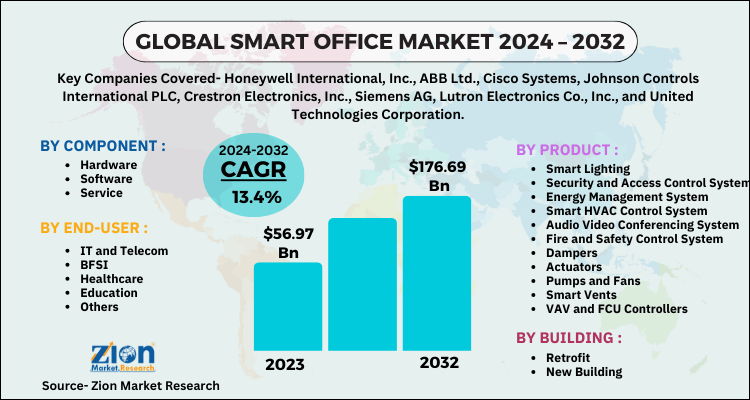
Smart Office Market by Product (Smart Lighting, Security and Access Control System, Energy Management System, Smart HVAC Control System, Audio Video Conferencing System, Fire and Safety Control System, Dampers, Actuators, Pumps & Fans, Smart Vents, and VAV and FCU Controllers), by Building (Retrofit and New Building), by Component (Hardware, Software, and Service), and by End-User (IT and Telecom, BFSI, Healthcare, Education, and Others): Global Industry Perspective, Comprehensive Analysis, and Forecast, 2024-2032
| Market Size in 2023 | Market Forecast in 2032 | CAGR (in %) | Base Year |
|---|---|---|---|
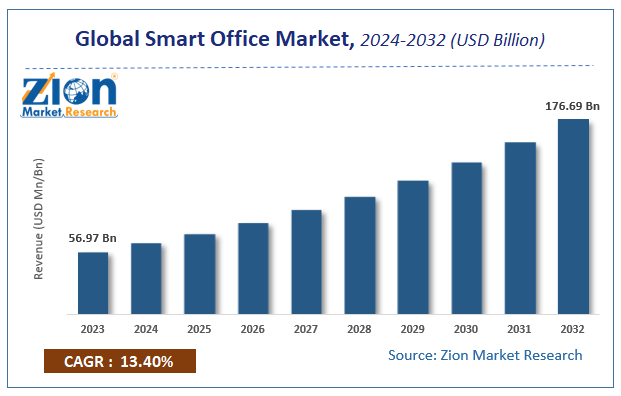
| USD 56.97 Billion | USD 176.69 Billion | 13.4% | 2023 |
Smart Office Market Insights
Zion Market Research has published a report on the global Smart Office Market, estimating its value at USD 56.97 Billion in 2023, with projections indicating that it will reach USD 176.69 Billion by 2032. The market is expected to expand at a compound annual growth rate (CAGR) of 13.4% over the forecast period 2024-2032. The report explores the factors fueling market growth, the hitches that could hamper this expansion, and the opportunities that may arise in the Smart Office Market industry. Additionally, it offers a detailed analysis of how these elements will affect market demand dynamics and market performance throughout the forecast period.
The report covers a forecast and an analysis of the smart office market on a global and regional level. The study provides historical data from 2018 to 2023 along with a forecast from 2024 to 2032 based on revenue (USD Billion). The study includes drivers and restraints of the smart office market along with the impact they have on the demand over the forecast period. Additionally, the report includes the study of opportunities available in the smart office market on a global level.
This report offers a comprehensive market analysis along with market trends, drivers, and restraints of the smart office market. This report includes a detailed competitive scenario and product portfolio of the key vendors. To understand the competitive landscape in the market, an analysis of Porter’s Five Forces Model for the market has also been included. The study encompasses a market attractiveness analysis, wherein all the segments are benchmarked based on their market size, growth rate, and general attractiveness.
Offices integrated with latest technologies for simplifying working procedures in an organization is termed as a smart office. These technically advanced offices are designed to facilitate extreme flexibility through extensive use of network-based devices. As compared to previous traditional offices, smart office systems are highly preferred due to the high security offered by them.
The smart office market is segmented on the basis of product, building, component, end-user, and region. The product segment includes energy management system, smart HVAC control system, smart lighting, security, and access control system, audio-video conferencing system, fire, and safety control system, actuators, dampers, smart vents, pumps and fans, and VAV and FCU controllers. The component segment includes hardware, software, and service. The building segment includes retrofit and new building. IT and telecom, BFSI, healthcare, education, and others comprise the end-user segment of this market. By geography, the market is segmented into North America, Europe, Latin America, Asia Pacific, and the Middle East and Africa. Each region has been further segmented into countries, such as the U.S., Canada, Mexico, UK, France, Germany, China, India, Japan, South Korea, Brazil, Argentina, and GCC countries.
Smart Office Market: Report Scope
| Report Attributes | Report Details |
|---|---|
| Report Name | Smart Office Market |
| Market Size in 2023 | USD 56.97 Billion |
| Market Forecast in 2032 | USD 176.69 Billion |
| Growth Rate | CAGR of 13.4% |
| Number of Pages | 151 |
| Key Companies Covered | Honeywell International, Inc., ABB Ltd., Cisco Systems, Johnson Controls International PLC, Crestron Electronics, Inc., Siemens AG, Lutron Electronics Co., Inc., and United Technologies Corporation |
| Segments Covered | By product, By building, By component, By end-user and By Region |
| Regions Covered | North America, Europe, Asia Pacific (APAC), Latin America, Middle East, and Africa (MEA) |
| Base Year | 2023 |
| Historical Year | 2018 to 2022 |
| Forecast Year | 2024 - 2032 |
| Customization Scope | Avail customized purchase options to meet your exact research needs. Request For Customization |
The report covers a detailed competitive outlook including the market share and company profiles of the key participants operating in the global smart office market, such as Honeywell International, Inc., ABB Ltd., Cisco Systems, Johnson Controls International PLC, Crestron Electronics, Inc., Siemens AG, Lutron Electronics Co., Inc., and United Technologies Corporation.
This report segments the global smart office market into:
Smart Office Market: Product Analysis
- Smart Lighting
- Security and Access Control System
- Energy Management System
- Smart HVAC Control System
- Audio Video Conferencing System
- Fire and Safety Control System
- Dampers
- Actuators
- Pumps and Fans
- Smart Vents
- VAV and FCU Controllers
Smart Office Market: Building Analysis
- Retrofit
- New Building
Smart Office Market: Component Analysis
- Hardware
- Software
- Service
Smart Office Market: End-User Analysis
- IT and Telecom
- BFSI
- Healthcare
- Education
- Others
Smart Office Market: Regional Analysis
- North America
- The U.S.
- Europe
- UK
- France
- Germany
- Asia Pacific
- China
- Japan
- India
- Latin America
- Brazil
- Middle East and Africa
Table Of Content
Methodology
FrequentlyAsked Questions
This report offers a comprehensive market analysis along with market trends, drivers, and restraints of the smart office market. This report includes a detailed competitive scenario and product portfolio of the key vendors. To understand the competitive landscape in the market, an analysis of Porter’s Five Forces Model for the market has also been included. The study encompasses a market attractiveness analysis, wherein all the segments are benchmarked based on their market size, growth rate, and general attractiveness.
The Smart Office Market was valued at USD 56.97 Billion in 2023.
The Smart Office Market is expected to reach USD 176.69 Billion by 2032, growing at a CAGR of 13.4% between 2024 to 2032.
Global Smart Office Market players such as Honeywell International, Inc., ABB Ltd., Cisco Systems, Johnson Controls International PLC, Crestron Electronics, Inc., Siemens AG, Lutron Electronics Co., Inc., and United Technologies Corporation.
The Regional segment includes the current and forecast demand for North America, Europe, Asia Pacific, Latin America, and the Middle East and Africa.
HappyClients

