Self-Service BI Market Size, Share, Growth Report 2032

Self-Service BI Market By Type (Software and Services), By Deployment Mode (On-premise Deployment and Cloud-based Deployment), By Application (Fraud and Security Management, Sales and Marketing Management, Risk and Compliance Management, Operations Management and Others), By End-use Industry (Banking, Financial Services and Insurance, Retail and Ecommerce, Telecommunications and IT, Healthcare and Life Sciences, Government and Defense and Others) and By Region: Global Industry Perspective, Comprehensive Analysis and Forecast, 2024 - 2032
| Market Size in 2023 | Market Forecast in 2032 | CAGR (in %) | Base Year |
|---|---|---|---|
| USD 5.85 Billion | USD 17.41 Billion | 12.89% | 2023 |
Self-Service BI Market Insights
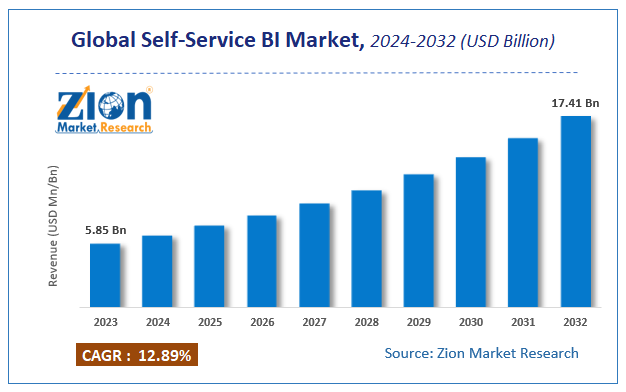
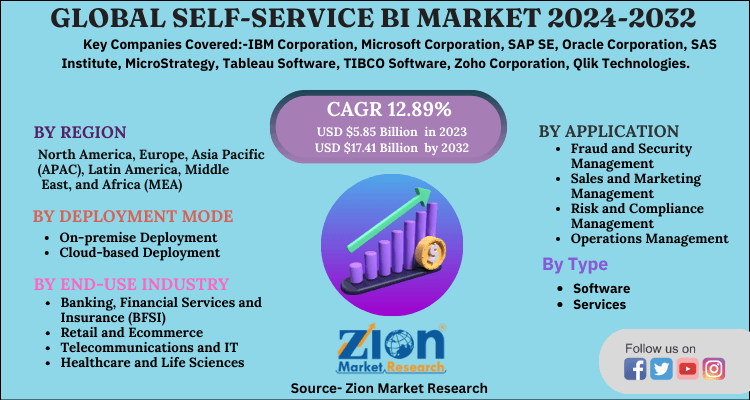
According to a report from Zion Market Research, the global Self-Service BI Market was valued at USD 5.85 Billion in 2023 and is projected to hit USD 17.41 Billion by 2032, with a compound annual growth rate (CAGR) of 12.89% during the forecast period 2024-2032. This report explores market strengths, weakness, opportunities, and threats. It also provides valuable insights into the market's growth drivers, challenges, and the future prospects that may emerge in the Self-Service BI Market industry over the next decade.
Global Self-Service BI Market Size And Industry Analysis
Self-Service BI (Business Intelligence) is a tool that helps end users, with limited or no technical skills regarding data analytics, to access data, customize and design their own reports. Subsequently, it provides them with tools to evaluate and analyze the data, to make informed decisions and strategies, for their business activities. It is used across a multitude of business functions such as Operations, Sales, Marketing, Finance, Production and Human Resources.
The significant demand for competitive insights and the ability of Self-Service BI tools to perform with increased operational convenience are some of the major factors that are augmenting the growth of the Self-Service BI market, globally. The availability of ceaseless volume of business data, advances the market for Self-Service BI tools in the Banking Industry.
Growth Factors
The ceaseless volume of business data, significant demand for competitive insights, ability of Self-Service BI tools to perform with increased operational convenience and to offer enhanced operational accountability are some of the major factors that drive the growth of the Self-Service BI market.
Business activities generate an enormous amount of data from their periodic operations, with an average of over 2.6 quintillion bytes every day, to make their business decisions and strategies. This is achieved by analyzing the data and identifying specific patterns and associations within it. It requires technical skills and prolonged durations.
However, Self-Service BI models make it exceptionally easy to analyze the data, without being reliable on technical skills. They identify trends in the data conveniently, thereby, enhancing the operation speed and reducing the dependency on a number of resources. The ever-increasing volume of business data and the competitive environment is expected to drive the demand for the Self-Service BI market, during the forecast period.
Self-Service BI Market: Report Scope
| Report Attributes | Report Details |
|---|---|
| Report Name | Self-Service BI Market |
| Market Size in 2023 | USD 5.85 Billion |
| Market Forecast in 2032 | USD 17.41 Billion |
| Growth Rate | CAGR of 12.89% |
| Number of Pages | 178 |
| Key Companies Covered | IBM Corporation, Microsoft Corporation, SAP SE, Oracle Corporation, SAS Institute, MicroStrategy, Tableau Software, TIBCO Software, Zoho Corporation, Qlik Technologies, Datapine GmbH and Looker among others |
| Segments Covered | By Type, By Deployment Mode, By Application, By End-use Industry and By Region |
| Regions Covered | North America, Europe, Asia Pacific (APAC), Latin America, Middle East, and Africa (MEA) |
| Base Year | 2023 |
| Historical Year | 2018 to 2022 |
| Forecast Year | 2024 - 2032 |
| Customization Scope | Avail customized purchase options to meet your exact research needs. Request For Customization |
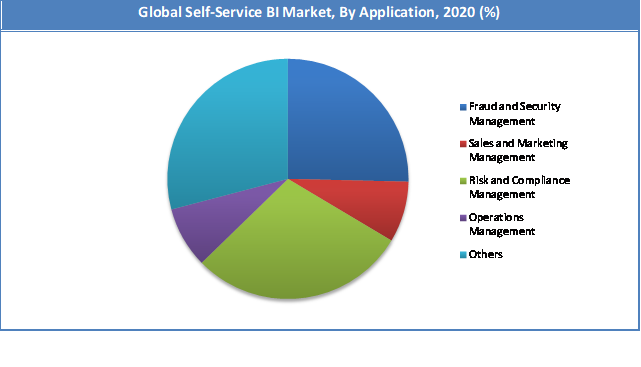
Application Segment Analysis Preview
The fraud and security management segment held a share of over 35% in 2020. This can be accredited to their features such as detection of potential threats, evaluation and elimination of the risks and threats.
The soaring adoption rate of cloud computing, enhanced demand for system integration, escalated demand for big data analytics and artificial intelligence, raise security concerns as well as enhance the risk of cyberattacks. Self-Service BI models provide risk and compliance tools to protect the data. Additionally, they provide tools to secure the data and mitigate data breaches and data loss, thereby, managing the security of the host system and network.
Subsequently, the sales and marketing management segment and the predictive asset maintenance segment, contribute to the self-service BI market, majorly. This is attributable to their distinguished ability of aiding in the decisions that enhance the market share, revenue and growth of the business.
End-use Industry Segment Analysis Preview
The Banking, Financial Services and Insurance (BFSI) segment is anticipated to reach a substantial CAGR between 2021 and 2028. This is attributable to the ability of Self-Service BI models to easily identify trends and to perform with relatively reduced utilization of resources.
Self-Service BI models, in the BFSI segment, provide intelligent automation, granular and critical insights and integration tools, to overcome the data silos concern. Additionally, they augment both external as well as internal processes and performance. Owing to these features, Self-Service BI models have found a huge role in the BFSI segment.
Subsequently, the Healthcare and Life Sciences segment is expected to become one of the largest consumers of the Self-Service BI markets, during the forecast period. This is attributable to the increase in data collection practices, from medical devices and gadgets, to better understand and treat acute and chronic conditions.
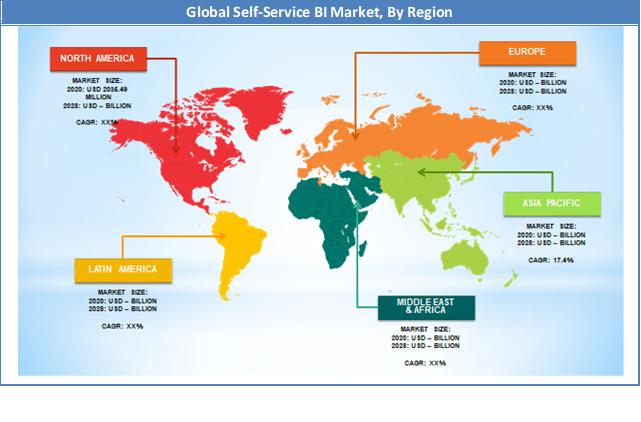
Regional Analysis Preview
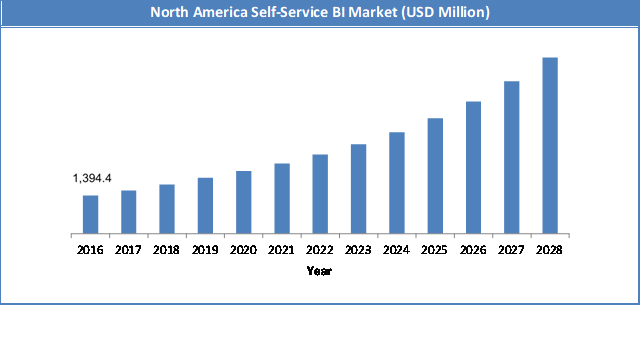
The North America region held a share of over 33% in 2020. This immense share is attributable to various factors such as the presence of developed economies like the US and Canada, technological advancements, the prominence of innovation and the increase in the amount of Research and Development (R&D) activities.
Countries like the US and Canada largely invest in R&D activities, for a wide number of applications. They also focus on bringing novel technologies and innovations in a number of industries across various business functions such as sales, marketing, operations, among others.
Additionally, the North American region has a huge Banking, Financial Services and Insurance (BFSI) sector. It stores tremendous amount of data from credit cards, debit cards, transaction histories and web interactions. With the rise of R&D, technological advancements, innovations and sectors such as BFSI, retail and ecommerce, in the region, the Self-Service BI market is expected to grow as well.
The Asia Pacific region is expected to grow with a CAGR of over 17.4% between 2021 and 2028. This massive growth can be credited to several factors such as the presence of large number of developing economies, increased adoption of Machine Learning (ML), Artificial Intelligence (AI), Internet of Things (IoT) and Big Data Analytics, in the region.
Presence of large number of developing economies, contributes to its economic growth, rise in disposable incomes and enhanced standards of living. Due to this, the investments and competition in the retail, telecommunications, ecommerce, finance and technology sectors have been on a rise. Owing to this, these sectors attract a large number of customers and generate tremendous amounts of data.
Furthermore, due to increased technological advancements, the region is experiencing enhanced adoption of cloud computing services and big data. All of these factors are expected to boost the Self-Service BI market in the region.
Key Market Players & Competitive Landscape
Some of the key players in the self-service BI market are :
- IBM Corporation
- Microsoft Corporation
- SAP SE
- Oracle Corporation
- SAS Institute
- MicroStrategy
- Tableau Software
- TIBCO Software
- Zoho Corporation
- Qlik Technologies
- Datapine GmbH
- Looker among others.
The companies in the Self-Service BI market are focusing on coming up with novel technologies and upgrading their existing technologies. This strategy helps them in catering to the requirements of their end-users proficiently and also helps them in getting an advantage over their competitors. For instance, in July 2021, Zoho Corporation launched their new Self-Service BI Platform, which is powered by Artificial Intelligence (AI). It has relatively enhanced usability and shows upgraded characteristics, in terms of data collection, management and analysis.
Furthermore, players in the Self-Service BI market are focusing on mergers and acquisitions to enhance their market share. For instance, in August 2019, Tableau Software, a US based company, was acquired by Salesforce.
The global self-service BI market is segmented as follows:
By Type
- Software
- Services
By Deployment Mode
- On-premise Deployment
- Cloud-based Deployment
By Application
- Fraud and Security Management
- Sales and Marketing Management
- Risk and Compliance Management
- Operations Management
- Others
By End-use Industry
- Banking, Financial Services and Insurance (BFSI)
- Retail and Ecommerce
- Telecommunications and IT
- Healthcare and Life Sciences
- Government and Defense
- Others
By Region
- North America
- The U.S.
- Canada
- Europe
- France
- The UK
- Spain
- Germany
- Italy
- Rest of Europe
- Asia Pacific
- China
- Japan
- India
- South Korea
- Southeast Asia
- Rest of Asia Pacific
- Latin America
- Brazil
- Mexico
- Rest of Latin America
- Middle East & Africa
- GCC
- South Africa
- Rest of Middle East & Africa
Table Of Content
Methodology
FrequentlyAsked Questions
The Global self-service BI market was valued at USD 5.85 Billion in 2023.
The Global self-service BI market is expected to reach USD 17.41 Billion by 2032, with a CAGR of around 12.89% between 2024-2032.
Some of the key factors driving the Global self-service BI market growth are the ceaseless volume of business data, significant demand for competitive insights, ability of Self-Service BI tools to perform with increased operational convenience and to offer enhanced operational accountability.
North America region held a substantial share of the self-service BI market in 2023. This surge can be credited to the presence of developed economies like the US and Canada, technological advancements, the prominence of innovation and the increase in the amount of Research and Development activities.
Some of the major companies operating in the self-service BI market are IBM Corporation, Microsoft Corporation, SAP SE, Oracle Corporation, SAS Institute, MicroStrategy, Tableau Software, TIBCO Software, Zoho Corporation, Qlik Technologies, Datapine GmbH and Looker among others.
HappyClients

