Online Election Voting Software Market Size, Share, Trends, Growth and Forecast 2034

Online Election Voting Software Market By Offering (Software, Solutions), By Deployment (On Premises, Cloud Based), By Voting Type (Anonymous Voting, Weighted Voting, Proxy Voting), By Voting Location (Polling Site, Remote), By Application (Vote Integrity, Voter Management Services, Voter Upload Modules, Scheduling Options, Email Deliverability Reports, Third Party Scans, GDPR, Data Storage and Backups, Auditing, Security And Vote Customization), By Platform (Smartphone, PC, Tablet, Kiosks), By End User (Government, Bar Associations, Universities, Award Shows, Corporate Organizations, Unions), and By Region: Global and Regional Industry Overview, Market Intelligence, Comprehensive Analysis, Historical Data, and Forecasts 2025 - 2034
| Market Size in 2024 | Market Forecast in 2034 | CAGR (in %) | Base Year |
|---|---|---|---|
| USD 500.12 Million | USD 1485.33 Million | 11.5% | 2024 |
Industry Perspective:
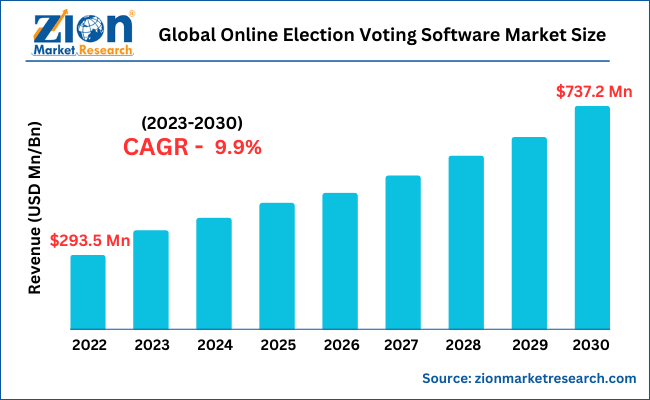
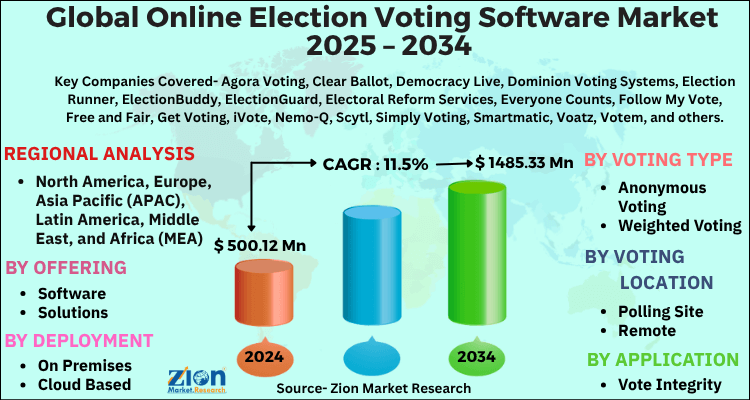
The global online election voting software market size was worth around USD 500.12 Million in 2024 and is predicted to grow to around USD 1485.33 Million by 2034 with a compound annual growth rate (CAGR) of roughly 11.5% between 2025 and 2034. The report analyzes the global online election voting software market's drivers, restraints/challenges, and the effect they have on the demands during the projection period. In addition, the report explores emerging opportunities in the online election voting software industry.
Online Election Voting Software Market: Overview
Online voting is a way of casting a vote or opinion online, via electronic means. It is a preferred voting channel for many organizations running board, council, or committee elections, referendums, polls, or AGMs, due to its ease and flexibility. With voter encryption and one, two, or three-factor authentication, online voting system offers the most secure system on the market. Online election voting management software ensures efficient election, privacy protection, encourages participation, and ultimately reduces the election cost. The platform offers multiple ways to vote, and that includes mail, physical voting, or telephonic voting. It verifies every vote to prevent any fraud activities. It offers an indisputable result declaration process and suggests a future improvement.
Key Insights
- As per the analysis shared by our research analyst, the global online election voting software market is estimated to grow annually at a CAGR of around 11.5% over the forecast period (2025-2034).
- Regarding revenue, the global online election voting software market size was valued at around USD 500.12 Million in 2024 and is projected to reach USD 1485.33 Million by 2034.
- The online election voting software market is projected to grow at a significant rate due to rising adoption of blockchain, increasing demand for secure digital voting and biometric technologies, and the growing need for transparent and efficient electoral processes.
- Based on Offering, the Software segment is expected to lead the global market.
- On the basis of Deployment, the On Premises segment is growing at a high rate and will continue to dominate the global market.
- Based on the Voting Type, the Anonymous Voting segment is projected to swipe the largest market share.
- By Voting Location, the Polling Site segment is expected to dominate the global market.
- In terms of Application, the Vote Integrity segment is anticipated to command the largest market share.
- On the basis of Platform, the Smartphone segment is expected to dominate the global market.
- By End User, the Government segment is poised to hold the largest share of the global market.
- Based on region, North America is predicted to dominate the global market during the forecast period.
Online Election Voting Software Market: Growth Factors
Surge in need for reliable and efficient voting systems drives the growth of the market
The demand for online election voting software has been driven by several factors, including the need for secure and efficient voting systems. With the increasing use of technology in every aspect of life, many voters prefer to use online voting platforms to cast their ballots. This is particularly true for younger voters who are more comfortable with technology and expect to be able to vote online. Another driver of the global online election voting software market is the need to increase voter turnout. Online voting platforms can make it easier for people to vote by eliminating the need to travel to a polling station. This can be particularly beneficial for people who are unable to leave their homes, such as the elderly or disabled.
Online Election Voting Software Market: Restraints
Growing concerns over security of the system might hinder the growth of the market to an extent
One of the major restraints of the online election voting software market is the concern over the security of online voting systems. Despite advances in technology, many people are still wary of using online platforms to cast their ballots due to the risk of cyber-attacks or tampering. Another restraint is the lack of standardization in online voting systems. With many different types of software available, it can be difficult to ensure that all voting systems meet the same level of security and accuracy.
Online Election Voting Software Market: Opportunities
Increase in the adoption of blockchain-based voting systems create ample opportunities for the industry
The COVID-19 pandemic has accelerated the adoption of online voting platforms, which is expected to continue beyond the pandemic. This trend has led to the development of new online voting software solutions and the expansion of existing ones. Another opportunity in the online election voting software industry is the growing interest in blockchain-based voting systems, which offer increased security and transparency in the voting process. Blockchain technology ensures that every vote is recorded and cannot be tampered with, making it virtually impossible for anyone to manipulate the election results. This could help to increase trust in the voting process and encourage more people to vote.
Online Election Voting Software Market: Challenges
Limited access to technology among people in developing and underdeveloped nations acts as a challenge
One of the biggest challenges of the global online election voting software market is the need to ensure the integrity of the voting process. Online voting platforms must be able to protect against cyber-attacks and prevent any attempts to manipulate the results. Another challenge is ensuring that online voting systems are accessible to all voters, including those with disabilities or limited access to technology. This requires the development of user-friendly interfaces and the use of assistive technologies to ensure that all voters can cast their ballots securely and independently.
Online Election Voting Software Market: Segmentation Analysis
The global online election voting software market is segmented based on Offering, Deployment, Voting Type, Voting Location, Application, Platform, End User, and region.
Based on Offering, the global online election voting software market is divided into Software, Solutions.
On the basis of Deployment, the global online election voting software market is bifurcated into On Premises, Cloud Based.
By Voting Type, the global online election voting software market is split into Anonymous Voting, Weighted Voting, Proxy Voting.
In terms of Voting Location, the global online election voting software market is categorized into Polling Site, Remote.
By Application, the global Online Election Voting Software market is divided into Vote Integrity, Voter Management Services, Voter Upload Modules, Scheduling Options, Email Deliverability Reports, Third Party Scans, GDPR, Data Storage and Backups, Auditing, Security And Vote Customization.
On the basis of Platform, the global Online Election Voting Software market is divided into Smartphone, PC, Tablet, Kiosks.
In terms of End User, the global Online Election Voting Software market is divided into Government, Bar Associations, Universities, Award Shows, Corporate Organizations, Unions.
This has led to increased adoption of software solutions for government services such as tax filing, online registration, and permit applications. The COVID-19 pandemic has also accelerated this trend, as governments have been forced to adopt digital solutions to enable remote work and ensure the continuity of government services. Overall, the government segment of the market based on end-user is expected to continue growing as governments prioritize digital transformation in the coming years.
Recent Developments
- In 2020, Voatz, a mobile voting platform, announced a collaboration with the Department of Homeland Security to test the security of its platform in a simulated election environment.
- In 2018, Votem, an online voting provider, announced the launch of a blockchain-based voting platform that allows voters to cast their ballots securely and anonymously.
Online Election Voting Software Market: Report Scope
| Report Attributes | Report Details |
|---|---|
| Report Name | Online Election Voting Software Market |
| Market Size in 2024 | USD 500.12 Million |
| Market Forecast in 2034 | USD 1485.33 Million |
| Growth Rate | CAGR of 11.5% |
| Number of Pages | PagesNO |
| Key Companies Covered | Agora Voting, Clear Ballot, Democracy Live, Dominion Voting Systems, Election Runner, ElectionBuddy, ElectionGuard, Electoral Reform Services, Everyone Counts, Follow My Vote, Free and Fair, Get Voting, iVote, Nemo-Q, Scytl, Simply Voting, Smartmatic, Voatz, Votem, and others. |
| Segments Covered | By Offering, By Deployment, By Voting Type, By Voting Location, By Application, By Platform, By End User, and By Region |
| Regions Covered | North America, Europe, Asia Pacific (APAC), Latin America, The Middle East and Africa (MEA) |
| Base Year | 2024 |
| Historical Year | 2020 to 2024 |
| Forecast Year | 2025 to 2034 |
| Customization Scope | Avail customized purchase options to meet your exact research needs. Request For Customization |
Online Election Voting Software Market: Regional Analysis
Asia-Pacific region is predicted to grow rapidly during the forecast period
Based on region, the Asia-Pacific region is predicted to grow rapidly at an exponential CAGR in the global online election voting software market during the forecast period. The Asia Pacific region is witnessing a growing trend toward online voting. The region's large population, increasing internet & smartphone penetration, and growing awareness of the benefits of digital solutions are key drivers of this trend. In addition, many countries in the region have been forced to adopt digital solutions due to the COVID-19 pandemic, further accelerating the growth of the market. Governments in the region are also investing heavily in online voting systems to improve the transparency, accessibility, and security of their elections.
Online Election Voting Software Market: Competitive Players
The report provides a company market share analysis to give a broader overview of the key market players. In addition, the report also covers key strategic developments of the market, including acquisitions & mergers, new product launches, agreements, partnerships, collaborations & joint ventures, research & development, and regional expansion of major participants involved in the online election voting software market on a global and regional basis.
Some of the players operating in the global online voting software market are:
- Agora Voting
- Clear Ballot
- Democracy Live
- Dominion Voting Systems
- Election Runner
- ElectionBuddy
- ElectionGuard
- Electoral Reform Services
- Everyone Counts
- Follow My Vote
- Free and Fair
- Get Voting
- iVote
- Nemo-Q
- Scytl
- Simply Voting
- Smartmatic
- Voatz
- Votem
- VotingWorks.
The global online election voting software market is segmented as:
By Offering
- Software
- Solutions
By Deployment
- On Premises
- Cloud Based
By Voting Type
- Anonymous Voting
- Weighted Voting
- Proxy Voting
By Voting Location
- Polling Site
- Remote
By Application
- Vote Integrity
- Voter Management Services
- Voter Upload Modules
- Scheduling Options
- Email Deliverability Reports
- Third Party Scans
- GDPR
- Data Storage and Backups
- Auditing
- Security And Vote Customization
By Platform
- Smartphone
- PC
- Tablet
- Kiosks
By End User
- Government
- Bar Associations
- Universities
- Award Shows
- Corporate Organizations
- Unions
By Region
- North America
- The U.S.
- Canada
- Europe
- France
- The UK
- Spain
- Germany
- Italy
- Rest of Europe
- Asia Pacific
- China
- Japan
- India
- South Korea
- Southeast Asia
- Rest of Asia Pacific
- Latin America
- Brazil
- Mexico
- Rest of Latin America
- Middle East & Africa
- GCC
- South Africa
- Rest of Middle East & Africa
Table Of Content
Methodology
FrequentlyAsked Questions
Online voting is a way of casting a vote or opinion online, via electronic means. It is a preferred voting channel for many organizations running board, council, or committee elections, referendums, polls, or AGMs, due to its ease and flexibility. With voter encryption and one, two, or three-factor authentication, our online voting system offers the most secure system on the market. Online election voting management software ensures efficient election, privacy protection, encourages participation, and ultimately reduces the election cost. The platform offers multiple ways to vote, and that includes mail, physical voting, or by telephonic voting. It verifies every vote to prevent any fraudulent activities. It offers an indisputable result declaration process and suggests a future improvement.
The global online election voting software market is expected to grow due to increasing demand for secure, transparent, and convenient voting solutions, government digitalization initiatives, rising internet penetration, and the need for remote participation in elections.
According to a study, the global online election voting software market size was worth around USD 500.12 Million in 2024 and is expected to reach USD 1485.33 Million by 2034.
The global online election voting software market is expected to grow at a CAGR of 11.5% during the forecast period.
North America is expected to dominate the online election voting software market over the forecast period.
Leading players in the global online election voting software market include Agora Voting, Clear Ballot, Democracy Live, Dominion Voting Systems, Election Runner, ElectionBuddy, ElectionGuard, Electoral Reform Services, Everyone Counts, Follow My Vote, Free and Fair, Get Voting, iVote, Nemo-Q, Scytl, Simply Voting, Smartmatic, Voatz, Votem, among others.
The report explores crucial aspects of the online election voting software market, including a detailed discussion of existing growth factors and restraints, while also examining future growth opportunities and challenges that impact the market.
HappyClients

