Impregnating Resins Market Size, Share, Growth, Trends, and Forecast, 2034

Impregnating Resins Market By Type (Solvent-Based, and Solventless), By Application (Home Appliances, Motors & Generators, Transformers, Power Tools & Electric Tools, Automotive Components, and Others), By Resin Type (Epoxy, Polyester/Unsaturated Polyesters, Polyesterimide, Silicone, and Others), and By Region - Global and Regional Industry Overview, Market Intelligence, Comprehensive Analysis, Historical Data, and Forecasts 2025 - 2034
| Market Size in 2024 | Market Forecast in 2034 | CAGR (in %) | Base Year |
|---|---|---|---|
| USD 1949.04 Million | USD 3641.47 Million | 6.45% | 2024 |
What is Impregnating Resins Market Size?
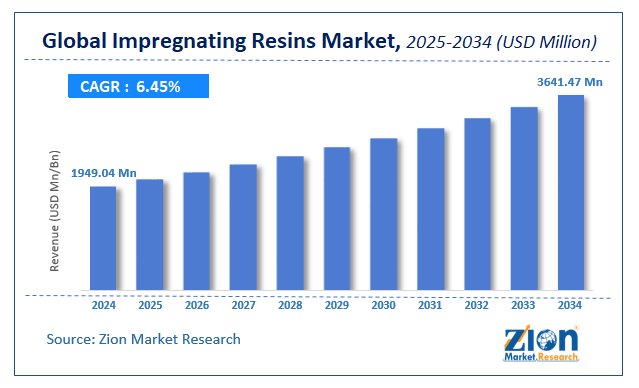
The global impregnating resins market size was worth around USD 1949.04 Million in 2024 and is predicted to grow to around USD 3641.47 Million by 2034 with a compound annual growth rate (CAGR) of roughly 6.45% between 2025 and 2034. The report analyzes the global impregnating resins market drivers, restraints/challenges, and the effect they have on the demands during the projection period. In addition, the report explores emerging opportunities in the impregnating resin market.
Impregnating Resins Market: Overview
Impregnating resins are liquids that are organic and slightly viscous. The resins generally contain formaldehyde, a naturally occurring compound, and are composed of trimers or dimers of the main molecule. However, they can turn into polymers by the act of curing, a chemical process involving the hardening or toughening of a given polymer. Impregnating resins are also called secondary insulators, and have the capability of curing the material to which they are applied.
Some of the main reasons why chemically enhanced liquid resins are gaining popularity is because they impart qualities like protection from climate changes, higher mechanical stability, and electrical insulation, along with better heat dissipation in copper coils or windings. They have wide applications in industrial units dealing with electrical motors, generators, and transformers along with other heavy metal industries.
Key Insights
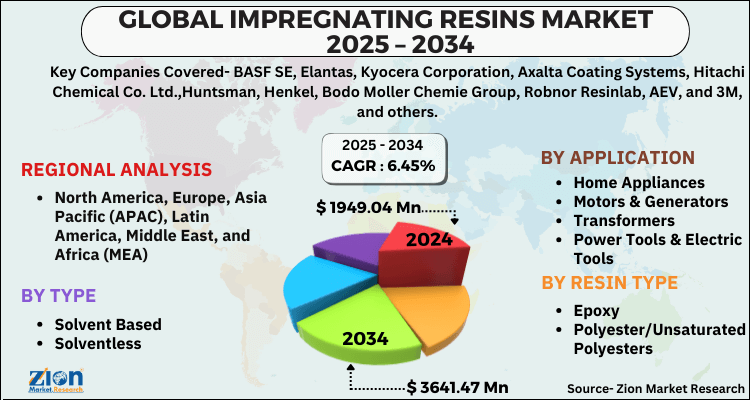
- As per the analysis shared by our research analyst, the global impregnating resins market is estimated to grow annually at a CAGR of around 6.45% over the forecast period (2025-2034).
- Regarding revenue, the global impregnating resins market size was valued at around USD 1949.04 Million in 2024 and is projected to reach USD 3641.47 Million by 2034.
- The impregnating resins market is projected to grow at a significant rate due to rising applications in electrical insulation, automotive, and aerospace industries.
- Based on Type, the Solvent-Based segment is expected to lead the global market.
- On the basis of Application, the Home Appliances segment is growing at a high rate and will continue to dominate the global market.
- Based on the Resin Type, the Epoxy segment is projected to swipe the largest market share.
- Based on region, Asia-Pacific & Europe is predicted to dominate the global market during the forecast period.
Impregnating Resins Market: Growth Drivers
Rising demand in the automotive sector to propel market growth
The global impregnating resins market is projected to grow owing to the increasing demand for protection-providing resins in the growing automotive sector. Impregnating resins provide excellent cover against the changing environmental factors thus improving the overall shelf-life of the product to which they are applied. Consumers of automotive sectors are demanding vehicles that can withstand environmental changes since vehicles are extremely prone to damage in case of sudden climatic conversions since the quality of insulation provided to the motor determines its efficiency and durability.
Resin impregnation is becoming more popular in the production of electric vehicles (EVs). The increasing demand for durable engines that also have qualities like lower noise emission and better power density, is on the rise. The market for EVs has been expanding owing to various factors like increased income, environmental impact awareness, and others. In the United States, around 607,659 units of EVs were sold in 2021 with a total sales revenue of 2.31 million
Impregnating Resins Market: Restraints
Low efficiency of solvent-based resins to restrict market expansion
The global market size may witness restricted growth owing to the poor performance of solvent-based impregnating resins since they offer poor heat resistance as compared to its counterpart. There are also concerns about the reaction of solvent-based resins with the external environment resulting in diminished performance quality.
Impregnating Resins Market: Opportunities
Growing demand for EV’s in emerging economies to provide excellent opportunities
The global impregnating resins market size is projected to benefit from the rising demand for electric vehicles in developing economies, where there is significant growth in the modernization of regions resulting in an improved standard of living and higher disposable income. There is a growing trend of international players entering the newer regions since they have massive growth potential. With collaborations with domestic players or through heavy investments, more industry giants are anticipated to enter the EV industry in emerging economies.
Impregnating Resins Market: Challenges
Increased total costs pose a challenge to market growth
Using impregnating resins leads to an overall increase in the final cost of production and eventually the product. There are growing measures toward adopting other most cost-effective ways of providing the same insulation as impregnating resins however at lower prices. Such trends may lead to challenges for global market growth.
Impregnating Resins Market: Segmentation
The global impregnating resin market is segmented based on type, application, resin type, and region.
Based on type, the global market segments are solvent-based and solventless. The global market is projected to be dominated by the solventless segment during the projection period owing to the better output presented by solvent-free resins. Since they are less viscous, they provide deeper and faster impregnation in rotational parts or machines. Other factors like versatile processability, high reactivity, and better stability are some of the reasons for a higher adoption rate. Generally, more viscous resins have 2-6 epoxy groups for every molecule.
Based on application, the global market is divided into home appliances, motors & generators, transformers, power tools & electric tools, automotive components, and others where automotive components generate the highest revenue. The vehicle industry witnessed a growth of around 2.9% in 2021 from 2020 owing to the increased number of options in the vehicle segment catering to each consumer unit.
Based on resin type, the global market is divided into epoxy, polyester / unsaturated polyesters, polyesteramides, silicone, and others. The global market may witness high growth in the silicone segment since these resins offer resistance to extremely high temperatures as well as harsh chemicals that are extremely common in today's urbanized world. Silicones have an operating temperature ranging between -60°C and up to +230°C
Recent Developments:
- In March 2019, Hexion, a Columbus-based chemical company, announced the launch of a new epoxy solution designed for composite production in space. The epoxy solution is termed a one-of-its-kind and is made of two components, which is projected to relieve constraints related to the production of aerospace composites without impacting the high performance of the final parts.
- In April 2020, Hexion launched a new yellowing epoxy solution along with a unique curing agent. The epoxy solution will provide concrete protection while the amine curing agent is expected to help manufacturers meet the regulations regarding lower indoor air emissions along with the reduction in costs.
Impregnating Resins Market: Report Scope
| Report Attributes | Report Details |
|---|---|
| Report Name | Impregnating Resins Market |
| Market Size in 2024 | USD 1949.04 Million |
| Market Forecast in 2034 | USD 3641.47 Million |
| Growth Rate | CAGR of 6.45% |
| Number of Pages | 187 |
| Key Companies Covered | BASF SE, Elantas, Kyocera Corporation, Axalta Coating Systems, Hitachi Chemical Co. Ltd.,Huntsman, Henkel, Bodo Moller Chemie Group, Robnor Resinlab, AEV, and 3M, and others. |
| Segments Covered | By Type, By Application, By Resin Type, and By Region |
| Regions Covered | North America, Europe, Asia Pacific (APAC), Latin America, The Middle East and Africa (MEA) |
| Base Year | 2024 |
| Historical Year | 2020 - 2023 |
| Forecast Year | 2025 - 2034 |
| Customization Scope | Avail customized purchase options to meet your exact research needs. Request For Customization |
Impregnating Resins Market: Regional Analysis
Asia-Pacific to lead regional revenue during the projection period
The global impregnating resins market is anticipated to register the highest growth in Asia-Pacific owing to the growing electronics and electrical industries across regions like India, China, Japan, Taiwan, and others. Countries in Asia-Pacific are emerging at the top in terms of growth in the automobile sector which is propelled by the increasing number of players providing a range of automobiles starting from middle-income groups to premium end. Urbanization and growing job opportunities have helped the population in these countries improve their standard of living while also contributing to increased disposable income.
Taiwan and China are leading globally in the electronics segment which is fueled by the government’s initiatives to help the industries grow further. A growing number of collaborations with international players, along with better policies for foreign investors, and increased funds are some of the reasons for the regional growth. North America is projected to register a significant CAGR driven by the growing electric vehicle segment, whereas the United States is projected to generate higher revenue.
Impregnating Resins Market: Competitive Analysis
The global impregnating resins market is home to players like-
- BASF SE
- Elantas
- Kyocera Corporation
- Axalta Coating Systems
- Hitachi Chemical Co. Ltd.,Huntsman
- Henkel
- Bodo Moller Chemie Group
- Robnor Resinlab
- AEV
- 3M
The global impregnating resins market is segmented as follows:
By Type
- Solvent Based
- Solventless
By Application
- Home Appliances
- Motors & Generators
- Transformers
- Power Tools & Electric Tools
- Automotive Components
- Others
By Resin Type
- Epoxy
- Polyester/Unsaturated Polyesters
- Polyesterimide
- Silicone
- Others
By Region
- North America
- The U.S.
- Canada
- Mexico
- Europe
- France
- The UK
- Spain
- Germany
- Italy
- Rest of Europe
- Asia Pacific
- China
- Japan
- India
- Australia
- South Korea
- Rest of Asia Pacific
- The Middle East & Africa
- Saudi Arabia
- UAE
- Egypt
- Kuwait
- South Africa
- Rest of the Middle East & Africa
- Latin America
- Brazil
- Argentina
- Rest of Latin America
Table Of Content
Methodology
FrequentlyAsked Questions
The global impregnating resins market is expected to grow due to expanding applications in electrical insulation, automotive, and aerospace industries due to their durability and thermal stability.
According to a study, the global impregnating resins market size was worth around USD 1949.04 Million in 2024 and is expected to reach USD 3641.47 Million by 2034.
The global impregnating resins market is expected to grow at a CAGR of 6.45% during the forecast period.
Asia-Pacific & Europe is expected to dominate the impregnating resins market over the forecast period.
Leading players in the global impregnating resins market include BASF SE, Elantas, Kyocera Corporation, Axalta Coating Systems, Hitachi Chemical Co. Ltd.,Huntsman, Henkel, Bodo Moller Chemie Group, Robnor Resinlab, AEV, and 3M, among others.
The report explores crucial aspects of the impregnating resins market, including a detailed discussion of existing growth factors and restraints, while also examining future growth opportunities and challenges that impact the market.
HappyClients

