High Performance Wheels Market Size, Share, Trends, Growth 2032

High Performance Wheels Market By Vehicle (Entry-Level Luxury Segment, Mid-Size Luxury Segment, Premium Compact Segment, And Others), By Material (Magnesium, Aluminum, Carbon Fiber, and Steel), By End Use (Aftermarket and OEM), and By Region: Global Industry Perspective, Market Size, Statistical Research, Market Intelligence, Comprehensive Analysis, Historical Trends, and Forecasts, 2024 - 2032
| Market Size in 2023 | Market Forecast in 2032 | CAGR (in %) | Base Year |
|---|---|---|---|
| USD 33.27 Billion | USD 84.34 Billion | 10.89% | 2023 |
High Performance Wheels Market Insights
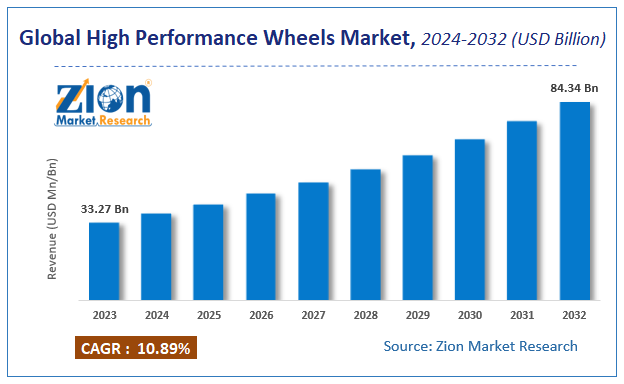
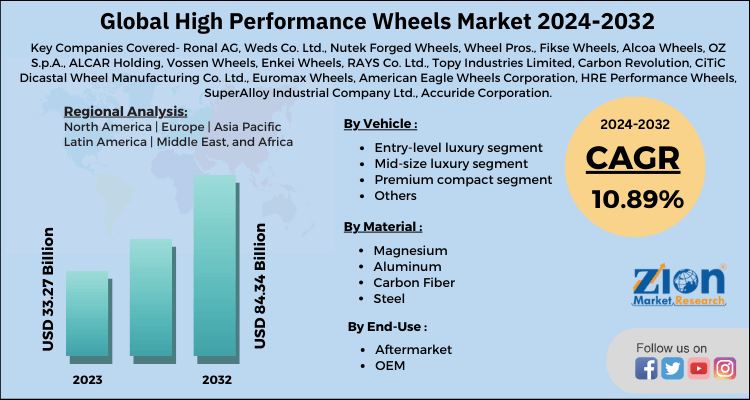
According to Zion Market Research, the global High Performance Wheels Market was worth USD 33.27 Billion in 2023. The market is forecast to reach USD 84.34 Billion by 2032, growing at a compound annual growth rate (CAGR) of 10.89% during the forecast period 2024-2032.
The report offers a comprehensive analysis of the market, highlighting the factors that will determine growth, potential challenges, and opportunities that could emerge in the High Performance Wheels industry over the next decade.
This report analyzes and estimates the high performance wheels market at global, regional, and country level. The research study provides historic data from 2018 to 2022 along with the forecast from 2024 to 2032 based on revenue (USD Billion). The report offers detailed insights of the high performance wheels market drivers and restraints along with their impact analysis at a global level from 2024 to 2032.
Global High Performance Wheels Market: Growth Factors
The report covers an in-depth analysis of the strategies adopted by major competitors in the global high performance wheels market. To understand the competitive landscape in the high performance wheels market, an analysis of Porter’s Five Forces model is also included. The research study comprises of market attractiveness analysis, wherein all the segments are benchmarked on the basis of their market size and growth rate.
The research study provides a decisive view on the global high performance wheels market based on vehicle, material, end-use, and region. All the segments of the market have been analyzed based on the past, present, and future trends. The market is estimated from 2024 to 2032.
High performance wheels are incredibly light in weight, owing to which they offer strong braking and extensive acceleration to the vehicles. These wheels are widely installed in the premium vehicle class to enhance both the aesthetic appearance and performance of the vehicles. The rims of the high performance wheels are mainly manufactured from different elements comprising magnesium, aluminum, carbon fiber, or steel, based on the applications.
However, high performance wheels-manufacturing procedures are quite complicated compared to the construction of other wheels, as the production methods of former ones involve expertise team and advanced technologies such as forging and casting. This is one of the major factors hindering the global high performance wheels market.
Global High Performance Wheels Market: Segmentation
The report encompasses the comprehensive analytical study of the global high performance wheels market by segmenting it on the basis of vehicle, material, end-use, and region.
Based on the vehicle segment, the global high performance wheels market is bifurcated into entry-level luxury segment, mid-size luxury segment, premium compact segment, and others.
Material-wise, the global industry is segmented into magnesium, aluminum, carbon fiber, and steel.
Based on the end-use, the global market is divided into aftermarket and OEM.
High Performance Wheels Market: Report Scope
| Report Attributes | Report Details |
|---|---|
| Report Name | High Performance Wheels Market |
| Market Size in 2023 | USD 33.27 Billion |
| Market Forecast in 2032 | USD 84.34 Billion |
| Growth Rate | CAGR of 10.89% |
| Number of Pages | 110 |
| Key Companies Covered | Ronal AG, Weds Co. Ltd., Nutek Forged Wheels, Wheel Pros., Fikse Wheels, Alcoa Wheels, OZ S.p.A., ALCAR Holding, Vossen Wheels, Enkei Wheels, RAYS Co. Ltd., Topy Industries Limited, Carbon Revolution, CiTiC Dicastal Wheel Manufacturing Co. Ltd., Euromax Wheels, American Eagle Wheels Corporation, HRE Performance Wheels, SuperAlloy Industrial Company Ltd., Accuride Corporation, Iochpe-Maxion, United Wheels Group, Steel Strips Wheels Limited, Automotive Wheels Ltd., Mandrus Wheel Company, BBS Kraftfahrzeugtechnik AG, Work Wheels USA, Performance Wheels Australia, and Konig Wheels |
| Segments Covered | By Vehicle, By Material,By End-Use And By Region |
| Regions Covered | North America, Europe, Asia Pacific (APAC), Latin America, Middle East, and Africa (MEA) |
| Base Year | 2023 |
| Historical Year | 2018 to 2022 |
| Forecast Year | 2024 - 2032 |
| Customization Scope | Avail customized purchase options to meet your exact research needs. Request For Customization |
Global High Performance Wheels Market: Regional analysis
The regional segmentation comprises the past, present, and estimated demand for the Middle East & Africa, North America, Asia Pacific, Latin America, and Europe. The regional segment is further split into the U.S., Canada, Mexico, UK, France, Germany, China, Japan, India, South Korea, Brazil, and Argentina among others.
Global High Performance Wheels Market: Competitive Players
Some of the significant players in the global high performance wheels market are:
- Ronal AG
- Weds Co. Ltd
- Nutek Forged Wheels
- Wheel Pros
- Fikse Wheels
- Alcoa Wheels
- OZ S.p.A.
- ALCAR Holding
- Vossen Wheels
- Enkei Wheels
- RAYS Co. Ltd
- Topy Industries Limited
- Carbon Revolution
- CiTiC Dicastal Wheel Manufacturing Co. Ltd
- Euromax Wheels
- American Eagle Wheels Corporation
- HRE Performance Wheels
- SuperAlloy Industrial Company Ltd
- Accuride Corporation
- Iochpe-Maxion
- United Wheels Group
- Steel Strips Wheels Limited
- Automotive Wheels Ltd
- Mandrus Wheel Company
- BBS Kraftfahrzeugtechnik AG
- Work Wheels USA
- Performance Wheels Australia
- Konig Wheels
The global high performance wheels market is segmented as:
Global High performance wheels Market: By Vehicle Segmentation Analysis
- Entry-level luxury segment
- Mid-size luxury segment
- Premium compact segment
- Others
Global High performance wheels Market: By Material Segmentation Analysis
- Magnesium
- Aluminum
- Carbon Fiber
- Steel
Global High performance wheels Market: By End-Use Segmentation Analysis
- Aftermarket
- OEM
Global High performance wheels Market: Regional Segmentation Analysis
- North America
- The U.S.
- Canada
- Europe
- France
- The UK
- Spain
- Germany
- Italy
- Rest of Europe
- Asia Pacific
- China
- Japan
- India
- South Korea
- Southeast Asia
- Rest of Asia Pacific
- Latin America
- Brazil
- Mexico
- Rest of Latin America
- Middle East & Africa
- GCC
- South Africa
- Rest of Middle East & Africa
Table Of Content
Methodology
FrequentlyAsked Questions
The adoption of connected motorcycles is being driven by the increasing demand for advanced safety features, such as collision detection and emergency response systems, and the increasing awareness of road safety.
The demand for high-performance wheels is being driven by the increasing popularity of performance-oriented motorcycles, luxury vehicles, and sports automobiles.
According to Zion Market Research, the global High Performance Wheels Market was worth USD 33.27 Billion in 2023. The market is forecast to reach USD 84.34 Billion by 2032.
According to Zion Market Research, the global High Performance Wheels Market a compound annual growth rate (CAGR) of 10.89% during the forecast period 2024-2032.
The regional segmentation comprises the past, present, and estimated demand for the Middle East & Africa, North America, Asia Pacific, Latin America, and Europe. The regional segment is further split into the U.S., Canada, Mexico, UK, France, Germany, China, Japan, India, South Korea, Brazil, and Argentina among others.
Some of the essential players flourishing the global high performance wheels market, but not restricted to include Ronal AG, Weds Co. Ltd., Nutek Forged Wheels, Wheel Pros., Fikse Wheels, Alcoa Wheels, OZ S.p.A., ALCAR Holding, Vossen Wheels, Enkei Wheels, RAYS Co. Ltd., Topy Industries Limited, Carbon Revolution, CiTiC Dicastal Wheel Manufacturing Co. Ltd., Euromax Wheels, American Eagle Wheels Corporation, HRE Performance Wheels, SuperAlloy Industrial Company Ltd., Accuride Corporation, Iochpe-Maxion, United Wheels Group, Steel Strips Wheels Limited, Automotive Wheels Ltd., Mandrus Wheel Company, BBS Kraftfahrzeugtechnik AG, Work Wheels USA, Performance Wheels Australia, and Konig Wheels.
HappyClients

