Genomics Personalized Health Market Size, Share, Growth Report 2032

Genomics Personalized Health Market By Technology (NGS platforms, RT-PCR, Microarray, and Genetic Analyzers), By Test Type (Oncology Testing, Infectious Disease Testing, Autoimmune Disease Testing, and Others), By End-User (Academics & Research Institutes, Diagnostic Centers, and Others), and By Region: Global Industry Perspective, Comprehensive Analysis and Forecast, 2024 - 2032
| Market Size in 2023 | Market Forecast in 2032 | CAGR (in %) | Base Year |
|---|---|---|---|
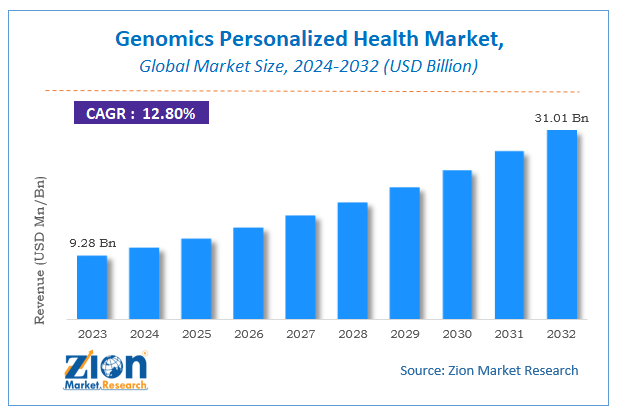
| USD 9.28 Billion | USD 31.01 Billion | 12.8% | 2023 |
Genomics Personalized Health Market Insights
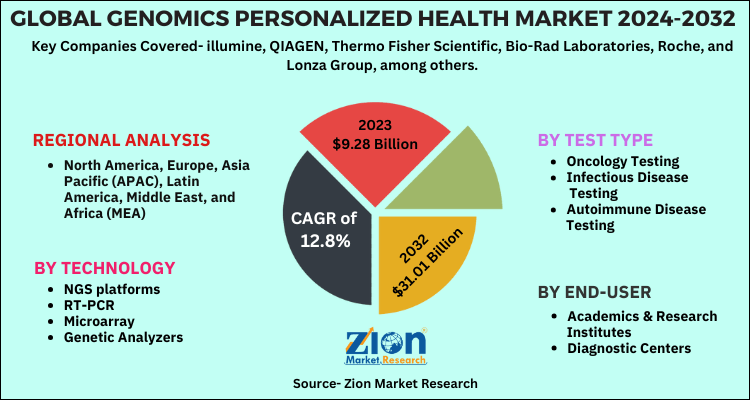
According to Zion Market Research, the global Genomics Personalized Health Market was worth USD 9.28 Billion in 2023. The market is forecast to reach USD 31.01 Billion by 2032, growing at a compound annual growth rate (CAGR) of 12.8% during the forecast period 2024-2032.
The report offers a comprehensive analysis of the market, highlighting the factors that will determine growth, potential challenges, and opportunities that could emerge in the Genomics Personalized Health Market industry over the next decade.
Global Genomics Personalized Health Market: Overview
Genomics personalized health is an evolving field in which physicians use diagnostic tests to identify specific biological markers, often genetic, that help determine which medical treatments and procedures will work best for each patient. Personalized health care can detect the onset of disease at its earliest stages, pre-empt the progression of disease, and, at the same time, increase the efficiency of the healthcare system by improving quality, accessibility, and affordability.
The dominance of the country is primarily based on huge presence of biopharmaceutical companies, government initiatives and supporting regulations, a large number of research institutes engaged in the study of personalized medicine, and a strong presence of healthcare infrastructure that includes oncology clinics and diagnostic centers equipped with advanced genomics technologies.
COVID-19 Impact Analysis
The COVID pandemic has hampered almost all sectors around the globe. However, it did not succeed in hampering cancer and infectious disease care. It has been observed that the number of outpatients, the frequency of outpatient visits of doctors, the number of patients in wards and the number of surgery operations decreased by 80.3%, 50.0%, 70.6%, and 75.0% in the first two months of the pandemic.
This was majorly witnessed due to fear of catching infection, strict lockdown, unavailability of public transport, and ban on intercity travel, among others. In line with this, all hospitals have developed detailed guidelines for protecting potentially vulnerable cancer patients under different conditions and have rearranged non-urgent consultations to minimize a given cancer patient’s exposure to any healthcare setting.
Genomics Personalized Health Market: Growth Factors
Governments around the globe, especially in developed countries, are making extra efforts to increase the affordability of healthcare to their citizen. In line with this, they are taking favorable steps to improve the market scenario. For instance, the US government has introduced a Health Information Technology for Economic and Clinical Health (HITECH) Act, included as part of the American Recovery and Reinvestment Act of 2009 (ARRA), formalized the Office of the National Coordinator for Health Information Technology and established a funding stream for infrastructure and incentive payments to providers who adopt and use health IT in a meaningful way.
Despite rapid scientific and technological advancement, the healthcare system has been relatively slow to integrate personalized medicine into clinical practice. As per our findings, only 40% of consumers are aware of genomics personalized health. Out of which, hardly, 10% recommended or discussed the genomics personalized medicine with them. In addition to this, most of the health care organizations do not have formalized plans to leverage advances in genomics and data analytics to personalize patient care, and are unprepared to implement personalized medicine programs
Genomics Personalized Health Market: Report Scope
| Report Attributes | Report Details |
|---|---|
| Report Name | Genomics Personalized Health Market |
| Market Size in 2023 | USD 9.28 Billion |
| Market Forecast in 2032 | USD 31.01 Billion |
| Growth Rate | CAGR of 12.8% |
| Number of Pages | 210 |
| Key Companies Covered | illumine, QIAGEN, Thermo Fisher Scientific, Bio-Rad Laboratories, Roche, and Lonza Group, among others |
| Segments Covered | By Technology, By Type, By End-User, and By Region |
| Regions Covered | North America, Europe, Asia Pacific (APAC), Latin America, Middle East, and Africa (MEA) |
| Base Year | 2023 |
| Historical Year | 2018 to 2022 |
| Forecast Year | 2024 - 2032 |
| Customization Scope | Avail customized purchase options to meet your exact research needs. Request For Customization |
Genomics Personalized Health Market: Segmentation Analysis
By Technology Segment Analysis
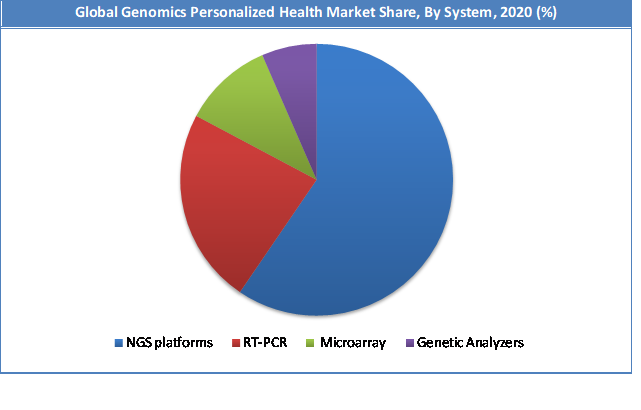
The NGS Platforms segment held a share of around 61.50 % in 2023. This is attributable to the genome personalized medicine; they are used for molecular profiling to discover biomarkers or novel drug targets. Transcriptome sequencing has been carried out to profile mRNA expression analysis and detect non-coding RNAs, such as miRNA, siRNA, piRNA, and lncRNA, which may be potential biomarkers.
Additionally, epigenomic sequencing, such as ChIP-sequencing, ribosome profiling, and bisulfite sequencing, has merged as a powerful tool for drug development and clinical practice.
By Test Type Segment Analysis
The Oncology Testing segment held a share of around 42.38 % in 2023. This is attributable to the increasing prevalence of cancers, the market is experiencing robust demand for advanced treatment methods for improved outcomes. This has further added fuel to the genomics of personalized therapy or medicine. With each passing year, a greater number of market players are trying to enter the area of personalized medicine for cancer treatment.
Today, various research institutes, pharma companies, and diagnostics laboratories are making use of genomics for developing and identifying targeted personalized medicine. Moreover, it helps in understanding the pharmacogenomics of cancer.
Personalized Health Market: Regional Analysis
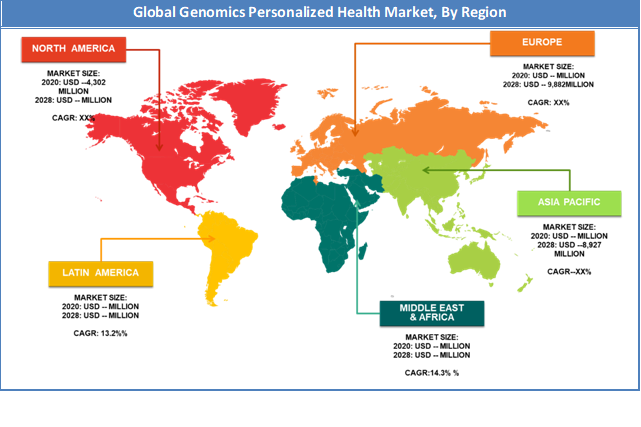
The North American region held a share of 40.31% in 2023. This is attributable to the presence of top companies such as Thermo Fisher Scientific, and Bio-Rad Laboratories, among others. Moreover, the increasing usage of automated solutions in the logistics sector is expected to generate huge demand for the market in this region.
Europe region is projected to grow at a CAGR of 16.4% over the forecast period. The genomics personalized health market and the region are further expected to continue holding its dominance over the forecast period. This is majorly attributed to the well-established healthcare industry, sophisticated healthcare as well as medical infrastructure, high healthcare spending, active presence of key industry players, and a large number of players who have strategic pipelines with gene therapy and genomics technologies.
Additionally, the availability of research grants and funding is further supporting the related developments in genomics personalization of health and creating space for revenue opportunities.
Genomics Personalized Health Market: Competitive Analysis
Some of the major players in the global Genomics Personalized Health market include:
- illumine
- QIAGEN
- Thermo Fisher Scientific
- Bio-Rad Laboratories
- Roche
- Lonza Group
QIAGEN has launched the novel QIAseq Targeted Methyl panels, the first and only NGS-based products for targeted methylation analysis with the increased analytical sensitivity and sequence-targeting capabilities of the company’s proprietary Single Primer Extension technology
Thermo Fisher's growth strategy includes significant investment in and expenditures for product development. It sells its products in several industries that are characterized by rapid and significant technological changes, frequent new product and service introductions and enhancements and evolving industry standards. Competitive factors include technological innovation, price, service and delivery, breadth of product line, customer support, e-business capabilities and the ability to meet the special requirements of customers. Its competitors may adapt more quickly to new technologies and changes in customers' requirements than it can. Without the timely introduction of new products, services and enhancements, products and services will likely become technologically obsolete over time, in which case revenue and operating results would suffer.
The global Genomics Personalized Health market is segmented as follows:
By Technology
- NGS platforms
- RT-PCR
- Microarray
- Genetic Analyzers
By Test Type
- Oncology Testing
- Infectious Disease Testing
- Autoimmune Disease Testing
- Others
By End-User
- Academics & Research Institutes
- Diagnostic Centers
- Others
By Region
- North America
- The U.S.
- Canada
- Europe
- France
- The UK
- Spain
- Germany
- Italy
- Rest of Europe
- Asia Pacific
- China
- Japan
- India
- South Korea
- Southeast Asia
- Rest of Asia Pacific
- Latin America
- Brazil
- Mexico
- Rest of Latin America
- Middle East & Africa
- GCC
- South Africa
- Rest of Middle East & Africa
Table Of Content
Methodology
FrequentlyAsked Questions
According to a study, the global Genomics Personalized Health market size was worth around USD 9.28 billion in 2023 and is expected to reach USD 31.01 billion by 2032.
The global Genomics Personalized Health market is expected to grow at a CAGR of 12.8% during the forecast period.
Some of the key factors driving the global genomics personalized health market growth are favorable government policies and increasing number of genomic personalized medicine.
North America is expected to dominate the Genomics Personalized Health market over the forecast period.
Some of the major companies operating in the Genomics Personalized Health Market are illumine, QIAGEN, Thermo Fisher Scientific, Bio-Rad Laboratories, Roche, Lonza Group, among others.
HappyClients

