Food Additives Market Size, Share, Trends, Growth and Forecast 2028

Food Additives Market By Type (Flavors, Hydrocolloids, Acidulants, Colors, Emulsifiers, Preservatives And Sweeteners), Process (Natural and Artificial), By Application (Bakery & Confectionery, Beverage, and Sauces, Dressings, Spices & Condiments, Convenience Foods, Dairy & Frozen Desserts, And Colors): Global Industry Perspective, Comprehensive Analysis and Forecast, 2024-2032
| Market Size in 2023 | Market Forecast in 2032 | CAGR (in %) | Base Year |
|---|---|---|---|
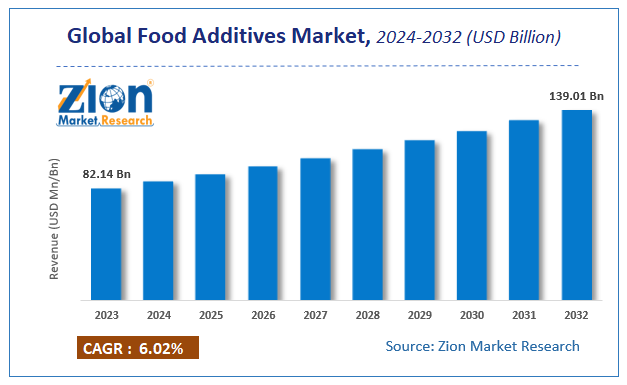
| USD 82.14 Billion | USD 139.01 Billion | 6.02% | 2023 |
Food Additives Market Insights
According to a report from Zion Market Research, the global Food Additives Market was valued at USD 82.14 Billion in 2023 and is projected to hit USD 139.01 Billion by 2032, with a compound annual growth rate (CAGR) of 6.02% during the forecast period 2024-2032. This report explores market strengths, weakness, opportunities, and threats. It also provides valuable insights into the market's growth drivers, challenges, and the future prospects that may emerge in the Food Additives Market industry over the next decade.
Food Additives Market: Overview
Food additives are usually in used in the production process of various food and beverages to maintain and develop the freshness, taste, and texture of the food. They are extracted from both natural and synthetic sources.
The major players in the global food additives market are emphasizing mergers & acquisitions in order to surge the product portfolio and also increase their presence across the globe. The companies in the market are focusing on expanding business across all the regions and developing strategies to size up production capability and strong global presence.
Food Additives Market: Growth Factors
Increasing focus on healthier lifestyles, rising workforce and increasing awareness about quality foods, are likely to augment the growth of the food additives market.
The food additives market is highly consolidated owing to the presence of major players. The company is emphasizing mergers & acquisitions in order to surge the product portfolio and also increase its presence across the globe.
Changing the lifestyle of the consumer tendency towards shifting to convenient, processed, and packaged products may spur market growth. They are added in small quantities in various products such as Bakery & Confectionery, Beverage, and Sauces, Dressings, Spices & Condiments, Convenience Foods, among others. Moreover, Increase in women workforce and changing lifestyle patterns of consumers help the market to grow in the coming years.
Food Additives Market: Report Scope
| Report Attributes | Report Details |
|---|---|
| Report Name | Food Additives Market |
| Market Size in 2023 | USD 82.14 Billion |
| Market Forecast in 2032 | USD 139.01 Billion |
| Growth Rate | CAGR of 6.02% |
| Number of Pages | 150 |
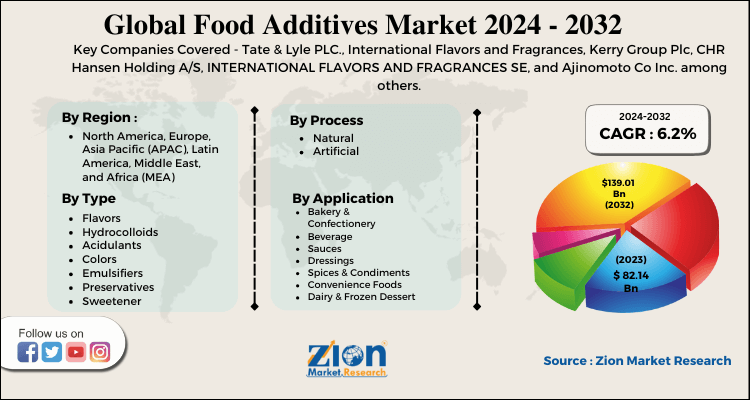
| Key Companies Covered | Tate & Lyle PLC., International Flavors and Fragrances, Kerry Group Plc, CHR Hansen Holding A/S, INTERNATIONAL FLAVORS AND FRAGRANCES SE, and Ajinomoto Co Inc. among others. |
| Segments Covered | By Type, By Application , By Process, and By Region |
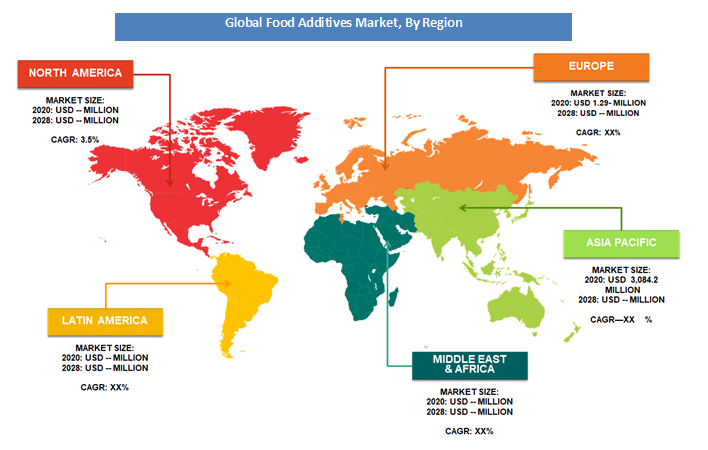
| Regions Covered | North America, Europe, Asia Pacific (APAC), Latin America, Middle East, and Africa (MEA) |
| Base Year | 2023 |
| Historical Year | 2018 to 2022 |
| Forecast Year | 2024 - 2032 |
| Customization Scope | Avail customized purchase options to meet your exact research needs. Request For Customization |
Food Additives Market: Segmentation
Type Segment Analysis Preview
Some of the major Food Additives types are Flavors, Hydrocolloids, Acidulants, Colors, Emulsifiers, Preservatives, and Sweeteners). The flavors segment gained a major demand in the coming years. High demand for new flavors from the food & beverages industry and continuous innovation drives the growth of the food additives market. In addition, increase in requirement from the fast food industry is expected to provide growth opportunities in the food flavors market during the forecast period.
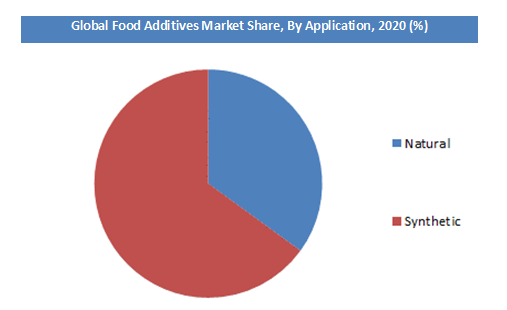
Source Segment Analysis Preview
By source, the market is segmented into Natural and Artificial Food Additives. Artificial flavors are chemical compounds that are used to add taste to the food or enhance the food flavoring characteristics of natural food flavors. Artificial flavors undergo stringent regulatory evaluation as compared to natural flavors. Chemicals used in artificial flavors involve less cost for processing as compared to natural flavors. Furthermore, the processing time of artificial flavors is extremely less and is eco-friendly. Artificial flavors are widely used across various industries, especially in the beverages and processed food industries
Application Segment Analysis Preview
The bakery & Confectionery segment holds the major share In the market. The sales of bakery & confectionery products are expected to increase by 2027 across the world with the change in taste of the global population. Bakery & confectionery offers innovative food items with delicious tastes. Asia-Pacific dominates the bakery & confectionery market. India and China are the biggest producers of grains, globally. Thus, bakery & confectionery products are manufactured in large volumes in these countries. Numerous industry giants, such as Cadbury Ltd. and Nestle S.A., focus on increasing their production capacities in Asia-Pacific. India is the third largest manufacturer of biscuits in the world after the U.S. and China. Low cost, easy availability, and good taste are the major factors that drive the growth of the bakery & confectionery market.
Food Additives Market: Competitive Landscape
- Tate & Lyle PLC.
- International Flavors and Fragrances
- Kerry Group Plc
- CHR Hansen Holding A/S
- INTERNATIONAL FLAVORS AND FRAGRANCES SE
- Ajinomoto Co Inc.
The global Food Additives market is segmented as follows:
By Type
- Flavors
- Hydrocolloids
- Acidulants
- Colors
- Emulsifiers
- Preservatives
- Sweeteners
By Process
- Natural
- Artificial
By Application
- Bakery & Confectionery
- Beverage
- Sauces
- Dressings
- Spices & Condiments
- Convenience Foods
- Dairy & Frozen Desserts
- Others
By Region
- North America
- The U.S.
- Canada
- Europe
- France
- The UK
- Spain
- Germany
- Italy
- Rest of Europe
- Asia Pacific
- China
- Japan
- India
- South Korea
- Southeast Asia
- Rest of Asia Pacific
- Latin America
- Brazil
- Mexico
- Rest of Latin America
- Middle East & Africa
- GCC
- South Africa
- Rest of the Middle East & Africa
Table Of Content
Methodology
FrequentlyAsked Questions
The global Food Additives market was valued at USD 82.14 Billion in 2023.
The global Food Additives market is expected to reach USD 139.01 Billion by 2032, growing at a CAGR of 6.02% between 2021 to 2032.
Some of the key factors driving the global Food Additives market growth are Favorable regulations by FDA pertaining to the approval of food additives, Increasing demand for clean labeled products along with innovation in the food industry
North America was the biggest area for food additives market in 2023 and is likely to sustain its position in the years to come. The food additives market is majorly boosted by the rising demand from the U.S. for food additives. North America grabbed over 30% share of the global food additives market in 2023.
Some of the major companies operating in Food Additives market are International Flavors and Fragrances, Tate & Lyle PLC., CHR. Hansen Holding A/S, Kerry Group Plc, Ajinomoto Co Inc., and INTERNATIONAL FLAVORS AND FRAGRANCES SE among others.
HappyClients

