Edible Packaging Market Size & Share Report, Growth, Trends, 2032

Edible Packaging Market - By Source (Plant and Animal), By Raw Material (Seaweeds and Algae, Polysaccharides, Lipids, and Others), By End-Use (Food, Beverages, and Pharmaceuticals), By Packaging Process (Antimicrobial, Nanotechnology, Electrohydrodynamic, Coatings, and Microorganisms), and By Region: Global Industry Perspective, Comprehensive Analysis, and Forecast, 2024 - 2032-
| Market Size in 2023 | Market Forecast in 2032 | CAGR (in %) | Base Year |
|---|---|---|---|
| USD 649.65 Million | USD 1040.23 Million | 5.37% | 2023 |
Global Edible Packaging Market Insights
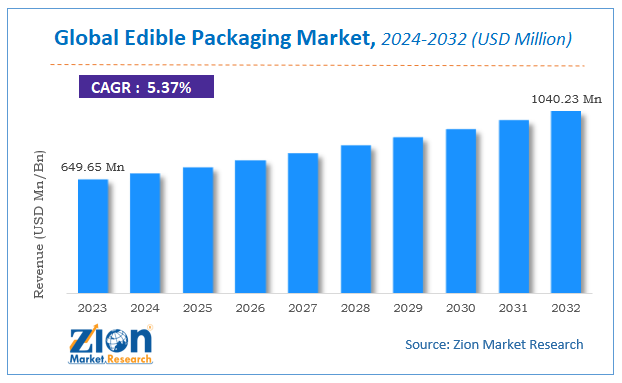
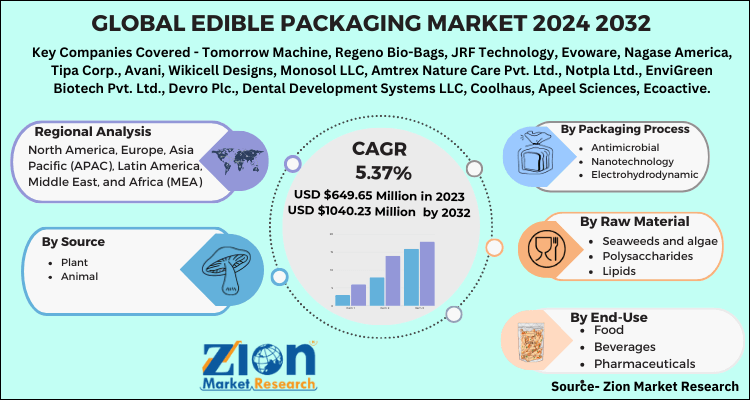
According to Zion Market Research, the global Edible Packaging Market was worth USD 649.65 Million in 2023. The market is forecast to reach USD 1040.23 Million by 2032, growing at a compound annual growth rate (CAGR) of 5.37% during the forecast period 2024-2032. The report offers a comprehensive analysis of the market, highlighting the factors that will determine growth, potential challenges, and opportunities that could emerge in the Edible Packaging industry over the next decade.
The report covers in-depth analysis of the strategies adopted by major competitors in the global Edible Packaging market. To understand the competitive landscape in the global Edible Packaging market, an analysis of Porter’s Five Forces model is also included. The research study comprises of market attractiveness analysis, wherein all the segments are benchmarked on the basis of their market size and growth rate.
Global Edible Packaging Market: Segmentation
The study provides a decisive view of the edible packaging market by segmenting the market based on by source, by packaging process, by raw material, by end-use and by region. All the segments have been analyzed based on present and future trends and the market is estimated from 2024 to 2032.
By source segment analysis includes plant and animal.
By packaging process segment analysis includes antimicrobial, nanotechnology, electrohydrodynamic, coatings, microorganisms.
By mixing method segment analysis includes solid-solid mixture, solid-liquid mixture, liquid-liquid mixture, liquid-gas mixture.
By raw material segment analysis includes seaweeds and algae, polysaccharides, lipids, others.
By end-use segment analysis includes food, fresh foods, bakery & confectionery products, frozen foods, beverages, non-alcoholic beverages, alcoholic beverages, pharmaceuticals.
The regional segmentation comprises the past, present, and estimated demand for the Middle East & Africa, North America, Asia Pacific, Latin America, and Europe. The regional segment is further split into the U.S., Canada, Mexico, UK, France, Germany, China, Japan, India, South Korea, Brazil, and Argentina among others.
The edible packaging market is gaining momentum basically due to the increasing government initiatives, advancements in the packaging technologies, and also the manufacture of new sources for edible packaging byproducts. The growing demand for edible packaging products in populated countries like China, Indonesia, and India are likely to propel the growth of the Edible Packaging market during the forecast period. In addition, the development of new government policies favoring edible packaging solutions and establishment of base for raw materials such as plant-based sources is anticipated to bolster the global Edible Packaging market growth. The increasing concern over the use of single-use plastics and its waste management is increasing the demand for alternative natural sources in the manufacture of edible packaging products.
Growing demand for sustainable sources in delivery and other foodservice applications is expected to boom the Edible Packaging market. The plan of food industries to include edible packaging in their wrapping paper, plastic sachets replacements, and containers is likely to help augment the growth of the Edible Packaging market.
Edible Packaging Market: Report Scope
| Report Attributes | Report Details |
|---|---|
| Report Name | Edible Packaging Market |
| Market Size in 2023 | USD 649.65 Million |
| Market Forecast in 2032 | USD 1040.23 Million |
| Growth Rate | CAGR of 5.37% |
| Number of Pages | 110 |
| Key Companies Covered | Tomorrow Machine, Regeno Bio-Bags, JRF Technology, Evoware, Nagase America, Tipa Corp., Avani, Wikicell Designs, Monosol LLC, Amtrex Nature Care Pvt. Ltd., Notpla Ltd., EnviGreen Biotech Pvt. Ltd., Devro Plc., Dental Development Systems LLC, Coolhaus, Apeel Sciences, Ecoactive, Mantrose UK Ltd., Do Eat, and Lactips |
| Segments Covered | By Source, By Packaging Process, By Raw Material, By End-Use And By Region |
| Regions Covered | North America, Europe, Asia Pacific (APAC), Latin America, Middle East, and Africa (MEA) |
| Base Year | 2023 |
| Historical Year | 2018 to 2022 |
| Forecast Year | 2024 - 2032 |
| Customization Scope | Avail customized purchase options to meet your exact research needs. Request For Customization |
Global Edible Packaging Market: Competitive Players
Some of the major players of the global Edible Packaging market include-
Tomorrow Machine
Regeno Bio-Bags
JRF Technology
Evoware
Nagase America
Tipa Corp.
Avani
Wikicell Designs
Monosol LLC
Amtrex Nature Care Pvt. Ltd.
Notpla Ltd.
EnviGreen Biotech Pvt. Ltd.
Devro Plc.
Dental Development Systems LLC
Coolhaus
Apeel Sciences
Ecoactive
Mantrose UK Ltd.
Do Eat
Lactips.
The report on Global Edible Packaging Market is segmented into:
Global Edible Packaging Market: By Source Segmentation Analysis
- Plant
- Animal
Global Edible Packaging Market: By Packaging Process Segmentation Analysis
- Antimicrobial
- Nanotechnology
- Electrohydrodynamic
- Coatings
- Microorganisms
Global Edible Packaging Market: By Raw Material Segmentation Analysis
- Seaweeds and algae
- Polysaccharides
- Lipids
- Others
Global Edible Packaging Market: By End-Use Segmentation Analysis
- Food
- Fresh foods
- Bakery & confectionery products
- Frozen foods
- Beverages
- Non-alcoholic beverages
- Alcoholic beverages
- Pharmaceuticals
Global Edible Packaging Market: By Regional Segmentation Analysis
- North America
- The U.S.
- Canada
- Europe
- France
- The UK
- Spain
- Germany
- Italy
- Rest of Europe
- Asia Pacific
- China
- Japan
- India
- South Korea
- Southeast Asia
- Rest of Asia Pacific
- Latin America
- Brazil
- Mexico
- Rest of Latin America
- Middle East & Africa
- GCC
- South Africa
- Rest of Middle East & Africa
Table Of Content
Methodology
FrequentlyAsked Questions
The Edible Packaging Market was valued at USD 649.65 Million in 2023.
The Edible Packaging Market is expected to reach USD 1040.23 Million by 2032, growing at a CAGR of of 5.37% between 2024 to 2032.
Global Edible Packaging Market players such as Tomorrow Machine, Regeno Bio-Bags, JRF Technology, Evoware, Nagase America, Tipa Corp., Avani, Wikicell Designs, Monosol LLC, Amtrex Nature Care Pvt. Ltd., Notpla Ltd., EnviGreen Biotech Pvt. Ltd., Devro Plc., Dental Development Systems LLC, Coolhaus, Apeel Sciences, Ecoactive, Mantrose UK Ltd., Do Eat, and Lactips.
Growing demand for sustainable sources in delivery and other foodservice applications is expected to boom the Edible Packaging market. The plan of food industries to include edible packaging in their wrapping paper, plastic sachets replacements, and containers is likely to help augment the growth of the Edible Packaging market.
The Regional segment includes the current and forecast demand for North America, Europe, Asia Pacific, Latin America, and the Middle East and Africa.
HappyClients

