Cross Border B2C E-Commerce Market Size, Share, Trends, Growth 2034

Cross Border B2C E-Commerce Market By Offering (In-house Brands, Assorted Brands), By Payment Method (Digital Wallets, Credit/Debit Cards, Internet Banking, and Others), By Category (Entertainment & Education, Apparel & Accessories, Consumer Electronics, Home Furnishing, Personal Care & Beauty, Healthcare & Nutrition, Footwear, Food & Beverage, and Others), and By Region - Global and Regional Industry Overview, Market Intelligence, Comprehensive Analysis, Historical Data, and Forecasts 2025 - 2034
| Market Size in 2024 | Market Forecast in 2034 | CAGR (in %) | Base Year |
|---|---|---|---|
| USD 1271.77 Billion | USD 8606.74 Billion | 27% | 2024 |
What is Cross Border B2C E-Commerce Market Size?
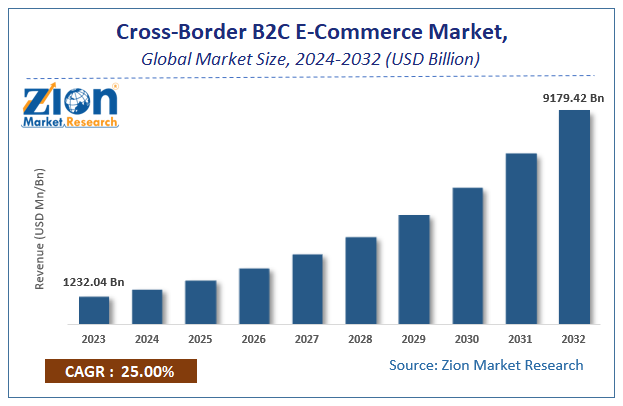
The global cross border B2C e-commerce market size was worth around USD 1271.77 billion in 2024 and is predicted to grow to around USD 8606.74 billion by 2034, with a compound annual growth rate (CAGR) of roughly 27% between 2025 and 2034.
Key Insights:
- As per the analysis shared by our research analyst, the global cross border B2C e-commerce market is estimated to grow annually at a CAGR of around 27% over the forecast period (2025-2034)
- In terms of revenue, the global cross border B2C e-commerce market size was valued at around USD 1271.77 billion in 2024 and is projected to reach USD 8606.74 billion by 2034.
- The cross border B2C e-commerce market is projected to grow significantly due to the middle-class population and rising disposable income, as well as improvements in cross-border e-commerce marketplaces and platforms, and the growth of global digital wallets and payment gateways.
- Based on offering, the assorted brands segment is expected to lead the market, while the in-house brands segment is expected to grow considerably.
- Based on payment method, the digital wallets segment is the dominating segment, while the credit/debit cards segment is projected to witness sizeable revenue over the forecast period.
- Based on category, the apparel & accessories segment is expected to lead the market compared to the consumer electronics segment.
- Based on region, the Asia Pacific is projected to dominate the global market during the estimated period, followed by Europe.
Cross Border B2C E-Commerce Market: Overview
Cross border B2C e-commerce refers to online trade where customers purchase products from businesses located in different countries via digital platforms. It enables global shopping by allowing customers to access a broader range of products, typically at competitive prices, while businesses benefit from the expanded geographic reach beyond domestic borders. The global cross border B2C e-commerce market is projected to witness substantial growth driven by the globalization of retail brands, improved shipping solutions and cross-border logistics, and rising demand for exclusive and niche products. Major retail marketplaces and brands are expanding internationally, streamlining shopping for consumers from global vendors. This trend is propelled by aggressive marketing strategies and localized websites that cater to different languages and cultural needs.
Moreover, logistics improvements, comprising real-time tracking systems, faster shipping, and international warehousing, are major facilitators for this industry. Companies like UPS, FedEx, and DHL are investing in global fulfillment networks to promise timely delivery, improving customer experience. Furthermore, customers are seeking unique, high-quality products that are unavailable in the domestic market from international sellers. Categories like electronics, cosmetics, and fashion hold leadership in cross-border purchases, fueled by the demand for premium quality and authenticity.
Although drivers exist, the global market is challenged by factors like complex customs regulations and duties, data privacy, and security concerns. Different nations impose varied customs duties and import taxes, making pricing unpredictable for sellers and customers. High customs clearance times may result in delayed deliveries and customer dissatisfaction. Also, consumers remain cautious regarding sharing financial and personal data with international vendors because of cybersecurity risks and inadequate enforcement of data protection regulations in a few regions.
Even so, the global cross border B2C e-commerce industry is well-positioned due to the integration of blockchain for transparency and assimilation of localized payment systems. Blockchain technology may improve transaction security, enhance supply chain transparency, and decrease fraud, enhancing customer confidence in cross-border transactions. Additionally, offering region-specific payment methods like Alipay in China and UPI in India may simplify international transactions and increase the number of buyers.
Cross Border B2C E-Commerce Market: Growth Drivers
Which factor is substantially fueling the global cross border B2C e-commerce market?
Global e-commerce marketplaces like AliExpress, SHEIN, Temu, and Amazon have made global shopping affordable and accessible. Marketplaces register more than 50% of worldwide online retail GMV, offering convenience, buyers' trust, and competitive pricing on cross-border goods and services. These platforms provide tools like buyer protection, local currency payments, and global fulfillment, reducing entry barriers for international sellers. Algorithms improve product discovery by marketing niche products worldwide, resulting in more cross-border transactions. Hence, marketplace globalization substantially fuels the cross border B2C e-commerce market.
How is the global cross border B2C e-commerce market positively impacted by faster & cheaper cross-border logistics and returns?
Improvements in global logistics have made cross-border deliveries more affordable and faster than ever. Private and postal courier networks have grown remarkably after 2020, facilitating double-digit parcel growth through 2022-23. Advancements like Delivered Duty Paid (DDP), regional fulfillment, and electronic customs declarations have reduced import hassles and delays. Retailers are also enhancing logistics with local drop-off points and prepaid return labels, resolving customer issues with returns. In the latest news, key market players introduced novel fulfillment centers and airfreight paths to shorten delivery times for global shoppers.
Cross Border B2C E-Commerce Market: Restraints
Currency conversion, payment fraud, and chargebacks hinder the market progress
Cross-border transactions hold a greater risk of chargebacks and fraud than domestic ones. Disputes and payment declines occur frequently due to regional banking differences and multi-currency processing. High foreign exchange fees and varying currency rates further elevate costs for customers. Recent headlines in 2024 underscored key marketplaces’ narrowing of seller verification procedures to fight fraud cases in Latin America and the Asia Pacific regions.
Cross Border B2C E-Commerce Market: Opportunities
How are live shopping, expansion, and social commerce positively impacting the growth of the cross border B2C e-commerce market?
Social commerce is becoming a key propeller for cross-border B2C e-commerce, mainly among millennials and Gen Z. Platforms like Instagram shopping, YouTube Live, and TikTok Shop allow direct purchase during live-streaming sessions, offering high engagement and conversion. Brands with live selling and influencer marketing will witness strong international traction. Recent 2024 reports underscore TiTok Shop’s growth into the European Union and the U.S. markets, driving more cross-border opportunities in the global cross border B2C e-commerce industry.
Cross Border B2C E-Commerce Market: Challenges
Limited post-sales service and return management restrict the market growth
After-sales service, comprising refunds and returns, remains a challenge in cross-border transactions. Customs complexities, high return shipping costs, and long processing times all adversely impact customer trust. Sellers without strong reverse logistics networks experience high operational costs and poor consumer retention. The recent 2024 report says that while marketplaces like AliExpress and Amazon are enhancing return systems, a majority of SMEs still struggle to offer smooth post-sales assistance internationally.
Cross Border B2C E-Commerce Market: Report Scope
| Report Attributes | Report Details |
|---|---|
| Report Name | Cross Border B2C E-Commerce Market |
| Market Size in 2024 | USD 1,271.77 Billion |
| Market Forecast in 2034 | USD 8606.74 Billion |
| Growth Rate | CAGR of 27% |
| Number of Pages | 221 |
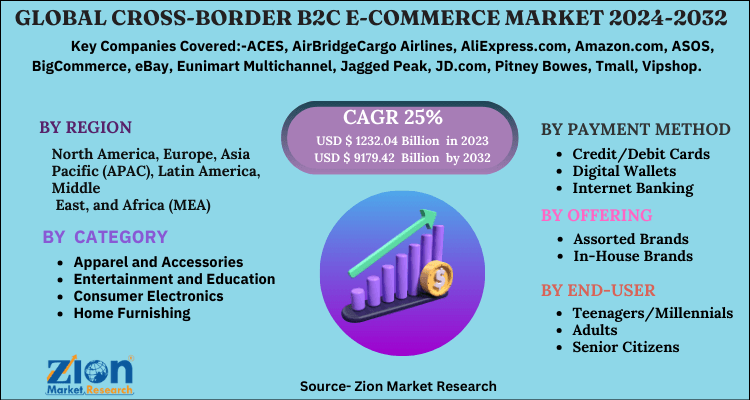
| Key Companies Covered | Alibaba Group, Amazon, eBay, JD.com, Rakuten, Shopify, Zalando, ASOS, MercadoLibre, Lazada, AliExpress, Newegg, Flipkart, Farfetch, Overstock, and others. |
| Segments Covered | By Offering, By Payment Method, By Category, and By Region |
| Regions Covered | North America, Europe, Asia Pacific (APAC), Latin America, Middle East, and Africa (MEA) |
| Base Year | 2024 |
| Historical Year | 2019 to 2023 |
| Forecast Year | 2025 - 2034 |
| Customization Scope | Avail customized purchase options to meet your exact research needs. Request For Customization |
Cross Border B2C E-Commerce Market: Segmentation
The global cross border B2C e-commerce market is segmented based on offering, payment method, category, and region.
Based on offering, the global cross border B2C e-commerce industry is divided into in-house brands and assorted brands. The assorted brands segment registered a substantial share of the market as consumers favor different and internationally recognized products in categories like electronics, beauty, and fashion. Key platforms benefit from the ability to aggregate multiple brands, offering users more competitive pricing and options. The traction of authenticity and premium quality boosts the demand for assorted brands among global shoppers.
Based on payment method, the global cross border B2C e-commerce market is segmented into digital wallets, credit/debit cards, internet banking, and others. The digital wallets segment holds leadership in the worldwide market owing to their speed, convenience, and enhanced security features. Platforms like Alipay, PayPal, and WeChat Pay are leaders because they simplify international trade and reduce currency conversion challenges. The rise in mobile commerce has also propelled the adoption of wallets as they incorporate smoothly with apps and smartphones.
Based on category, the global market is segmented as entertainment & education, apparel & accessories, consumer electronics, home furnishing, personal care & beauty, healthcare & nutrition, footwear, food & beverage, and others. The apparel & accessories segment held a dominating share of the market, fueled by the strong demand for international fashion brands and exceptional designs. Global platforms like Zara, ASOS, and SHEIN benefit from cross-border sales to attract consumers who prefer affordable and trendy clothing not available in domestic markets. Fast-fashion trends and social media also propel the segmental dominance.
Cross Border B2C E-Commerce Market: Regional Analysis
What gives Asia Pacific a competitive edge in the global Cross Border B2C E-Commerce Market?
Asia Pacific is likely to sustain its leadership in the cross border B2C e-commerce market due to high smartphone and internet penetration, speedy growth of middle-class population and disposable incomes, and supportive trade policies and free-trade agreements. APAC registers a substantial share, holding more than 2.8 billion consumers in 2023, denoting more than 50% of total online users. Affordable smartphones and broader 4G/5G networks have fueled the adoption of mobile commerce in nations like Southeast Asia, China, and India. This connectivity allows millions of users to engage in cross-border shopping with ease.
Also, the region has experienced a rise in income, with the middle-class populace anticipated to reach 3.5 billion individuals by 2030. Creating strong purchasing power for international products. Users in China and India are seeking premium products, exclusive items, and luxury brands from foreign markets. This economic transition has led to a shift in regional dominance.
Furthermore, economies in APAC benefit from trade contracts like the Regional Comprehensive Economic Partnership (RCEP), which decreases tariffs and streamlines cross-border regulations. These contracts motivate international sellers to target APAC consumers and facilitate smooth customs procedures. This increases the accessibility and affordability of imported goods for the regional buyers.
Europe continues to secure the second-highest share in the cross border B2C e-commerce industry, owing to the high digital connectivity and sophisticated e-commerce infrastructure, strong demand for premium brands and international products, and advanced payment infrastructure. Europe ranked second due to its high internet penetration, which exceeded 91% of the population in 2023, promising a digitally connected customer base. Economies like France, the United Kingdom, and Germany are forerunners in the adoption of online shopping, creating a strong environment for cross-border transactions. Well-developed logistic systems and advanced payment methods further reinforce the regional e-commerce outlook.
The regional consumers are highly inclined towards global brands and exclusive items that are usually sourced from non-European markets. Categories like electronics, fashion, and luxury goods dominate purchases, with cross-border purchases registering for approximately 25% of all online retail sales in Europe, as of 2023. This trend denotes the rising appetite for premium and variety quality. The region also boasts a sophisticated payment ecosystem, characterized by the broader adoption of secure cards, digital wallets, and localized payment solutions. Payment advancements, along with strong data protection under GDPR, raise consumer confidence in international transactions. This financial and legal security architecture enhances regional support for cross-border e-commerce development.
Cross Border B2C E-Commerce Market: Competitive Analysis
The leading players in the global cross border B2C e-commerce market are:
- Alibaba Group
- Amazon
- eBay
- JD.com
- Rakuten
- Shopify
- Zalando
- ASOS
- MercadoLibre
- Lazada
- AliExpress
- Newegg
- Flipkart
- Farfetch
- Overstock
Cross Border B2C E-Commerce Market: Key Market Trends
Growth of social commerce for cross-border shopping:
Social media platforms like Facebook, Instagram, and TikTok have become key propellers of cross-border sales. Brands leverage influencer promotion, integrated shopping features, and live streaming to target international customers directly. This social-based commerce trend is speedily expanding among younger consumers looking for trendy and niche products.
Focus on sustainable and green logistics:
Consumers are primarily concerned about the ecological impact of cross-border shipping. Therefore, e-commerce companies are heavily using eco-friendly packaging, green supply chain practices, and carbon-neutral shipping. This trend is shaping purchasing decisions and offering fresh avenues for brands that prefer sustainability in international trade.
The global cross border B2C e-commerce market is segmented as follows:
By Offering
- In-house Brands
- Assorted Brands
By Payment Method
- Digital Wallets
- Credit/Debit Cards
- Internet Banking
- Others
By Category
- Entertainment & Education
- Apparel & Accessories
- Consumer Electronics
- Home Furnishing
- Personal Care & Beauty
- Healthcare & Nutrition
- Footwear
- Food & Beverage
- Others
By Region
- North America
- The U.S.
- Canada
- Mexico
- Europe
- France
- The UK
- Spain
- Germany
- Italy
- Rest of Europe
- Asia Pacific
- China
- Japan
- India
- Australia
- South Korea
- Rest of Asia Pacific
- The Middle East & Africa
- Saudi Arabia
- UAE
- Egypt
- Kuwait
- South Africa
- Rest of the Middle East & Africa
- Latin America
- Brazil
- Argentina
- Rest of Latin America
Table Of Content
Methodology
FrequentlyAsked Questions
Cross border B2C e-commerce refers to online trade where customers purchase products from businesses located in different countries via digital platforms. It enables global shopping by allowing customers to access a broader range of products, typically at competitive prices, while businesses benefit from the expanded geographic reach beyond domestic borders.
The global cross border B2C e-commerce market is projected to grow due to competitive discounts and pricing on global products, surging demand for specialty and niche products worldwide, and the rise of shipping solutions and international logistics.
According to the study, the global cross border B2C e-commerce market size was worth around USD 1271.77 billion in 2024 and is predicted to grow to around USD 8606.74 billion by 2034.
The CAGR value of the cross border B2C e-commerce market is expected to be around 27% during 2025-2034.
Asia Pacific is expected to lead the global cross border B2C e-commerce market during the forecast period.
Emerging trends include social commerce integration, growth of mobile commerce, blockchain for secure payments, AI-driven personalization, sustainable cross-border logistics, and localized payment solutions.
The key players profiled in the global cross border B2C e-commerce market include Alibaba Group, Amazon, eBay, JD.com, Rakuten, Shopify, Zalando, ASOS, MercadoLibre, Lazada, AliExpress, Newegg, Flipkart, Farfetch, and Overstock.
The competitive landscape is highly fragmented, dominated by global marketplaces like Alibaba, Amazon, and eBay, alongside diverse niche platforms and regional players emphasizing specific geographies and product categories.
Leading players are adopting strategies such as expanding global logistics networks, integrating localized payment systems, forming regional partnerships, investing in mobile and social commerce platforms, and leveraging AI for personalized shopping to improve customer reach and engagement.
The report examines key aspects of the cross border B2C e-commerce market, including a detailed analysis of existing growth factors and restraints, as well as an examination of future growth opportunities and challenges that will impact the market.
HappyClients

