Aerial Equipment Market Share, Growth, Size, and Forecast 2032

Aerial Equipment Market By Product Type (Atrium / Spider Lifts, Boom Lifts, Cranes, Scissor Lifts), By Technology (Unpowered, Self-propelled, Vehicle-mounted), By Ownership (Rental, End-User Industry), By End-User (Fire Brigade, Construction, Industrial, Power Plant, Ship & Offshore, Others), and By Region - Global and Regional Industry Overview, Market Intelligence, Comprehensive Analysis, Historical Data, and Forecasts 2024-2032
| Market Size in 2023 | Market Forecast in 2032 | CAGR (in %) | Base Year |
|---|---|---|---|
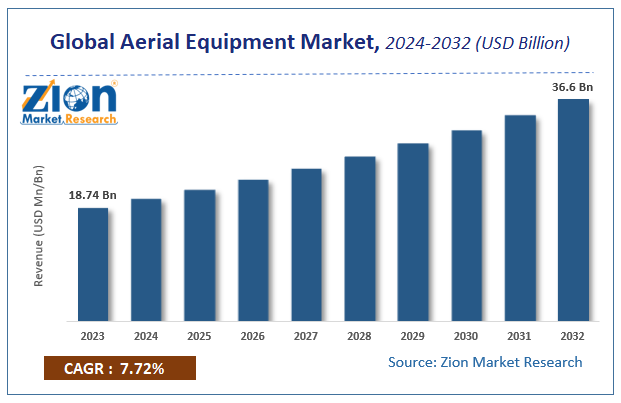
| USD 18.74 Billion | USD 36.6 Billion | 7.72% | 2023 |
Aerial Equipment Market Size
According to Zion Market Research, the global Aerial Equipment Market was worth USD 18.74 Billion in 2023. The market is forecast to reach USD 36.6 Billion by 2032, growing at a compound annual growth rate (CAGR) of 7.72% during the forecast period 2024-2032.
The report offers a comprehensive analysis of the market, highlighting the factors that will determine growth, potential challenges, and opportunities that could emerge in the Aerial Equipment Market industry over the next decade.
Aerial Equipment Market: Overview
Aerial equipment is mechanical devices that provide lift access for operators to inaccessible areas, with objects generally above two meters. Rapid urbanization has caused an increased number of infrastructure projects and dependence on machines has caused the aerial equipment industry to flourish. Additionally, increasing investments made by the local body administration in the industrial sector such as building airports and stadiums are giving vast opportunities for the aerial equipment industry.
The construction industry’s growth over the years backed by strict labor laws along with supportive government regulations are the real motivating factors for the market over the upcoming years. Due to the existing demand and less time for completing construction projects, the market for mobile cranes is increasing. However, high capital investments in industrial lifting equipment can cause a decline in the growth of the market over the forecast period. All the more, increasing advancements in equipment to enhance product capability and operational performance will propel the demand in the aerial equipment market.
COVID-19 Impact Analysis
The entire world was forced to go on a shutdown, causing all the labor-intensive activities to come to a saturation point, due to the outbreak of the pandemic. Due to the government regulations to save the people from the pandemic, there emerged a compulsive need to mechanize the labor-dependent work sectors. Factors like the shortage of labor and raw materials resulted in several problems in the development & design department of new equipment. All of this created a drastic gap in supply and demand, impacting the revenues of market players. Many factories were shut down, and cross-countries trade restrictions were imposed, therefore production was at stake in the aerial equipment market.
Aerial Equipment Market: Growth Factors
Increasing technological advancements and the growing need to cope up with the change in a supply-demand chain, lack of labor, and work efficiency requirements have worked in favor of the aerial equipment market. Furthermore, the local government’s extensive support in bringing smart city schemes into action has caused rapid urbanization. This in this case led to a movement and a steep increase in construction contracts.
There was a pressing need to complete construction contracts with utmost efficiency; which would not be possible without Aerial equipment for hassle-free work. The Construction industry across the globe is expected to revive the construction equipment industry revenue. Hence the global aerial equipment market is also growing. Growth in the construction industry, government regulations, and strict adherence to human safety concerns are some of the other factors driving the growth of the global aerial equipment market.
Aerial Equipment Market: Segmentation
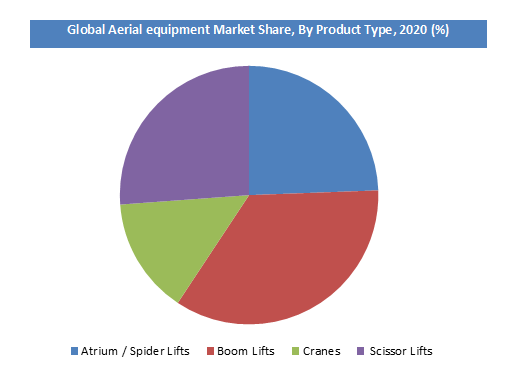
Product Type Segment Analysis Preview
Based on Product, the market is divided into Atrium / Spider Lifts, Boom Lifts, Cranes, and Scissor Lifts. The boom lifts segment holds dominance by holding the largest market share and is expected to witness the highest numbers for the forecast period. The attributed factors are increasing usage in complex architectural settings or limited workspace.
With features such as a tight turning radius, Atrium/Spider Lifts oscillating axle, more platform height, mobility, and compact design, boom lifts have an obvious edge over the other product types. However, the scissor lifts have maneuvering capability in tight spaces thus being used increasingly. The growing demand for scissor lifts in the maintenance and installation usage is likely to rise in the coming years.
Ownership Type Analysis Preview
Considering segmentation on the basis of ownership, the demand for the rental equipment is growing in the construction industry across the globe. Hence there is a notable growth of the construction equipment rental market which has opened up potential opportunities for the aerial equipment manufacturers. After analyzing the costs and consequential effects, it rental equipment is more profitable than end-user type of ownership.
End-User Type Segment Analysis Preview
On the basis of End-User, the market is bifurcated into Fire Brigade, Industrial, Power plant, Construction, Ship & Offshore and others. The construction sector dominated the end-user industry segment. The construction sector is expected to grow at a drastic measure due to increasing government and private investment in the real-estate sector and infrastructure development. Additionally, the growing concerns regarding the worker safety also anticipate increase in demand for the aerial equipment in the construction industry.
Aerial Equipment Market: Report Scope
| Report Attributes | Report Details |
|---|---|
| Report Name | Aerial Equipment Market |
| Market Size in 2023 | USD 18.74 Billion |
| Market Forecast in 2032 | USD 36.6 Billion |
| Growth Rate | CAGR of 7.72% |
| Number of Pages | 140 |
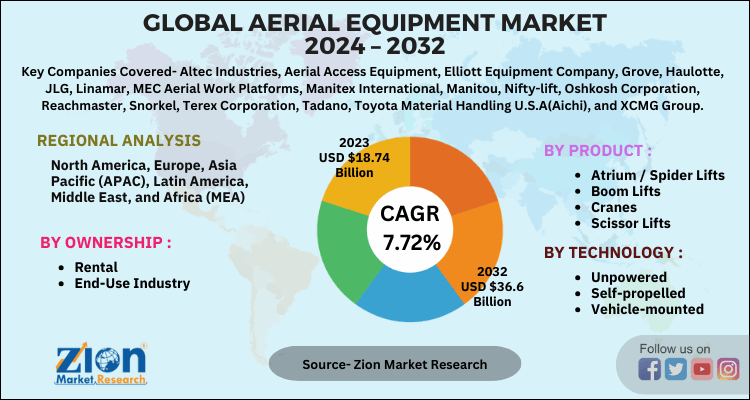
| Key Companies Covered | Altec Industries, Aerial Access Equipment, Elliott Equipment Company, Grove, Haulotte, JLG, Linamar, MEC Aerial Work Platforms, Manitex International, Manitou, Nifty-lift, Oshkosh Corporation, Reachmaster, Snorkel, Terex Corporation, Tadano, Toyota Material Handling U.S.A(Aichi), and XCMG Group., |
| Segments Covered | By Product, By Technology, By Ownership and By Region |
| Regions Covered | North America, Europe, Asia Pacific (APAC), Latin America, Middle East, and Africa (MEA) |
| Base Year | 2023 |
| Historical Year | 2018 to 2022 |
| Forecast Year | 2024 - 2032 |
| Customization Scope | Avail customized purchase options to meet your exact research needs. Request For Customization |
Aerial Equipment Market: Regional Analysis
North America dominates the aerial equipment market due to the high adoption rate of advanced construction and maintenance technologies. The region’s well-developed infrastructure and a strong focus on safety standards in industries like construction, oil and gas, and utilities drive demand for aerial equipment. The United States plays a pivotal role in this dominance, with large-scale projects and extensive use of aerial lifts for both commercial and industrial purposes.
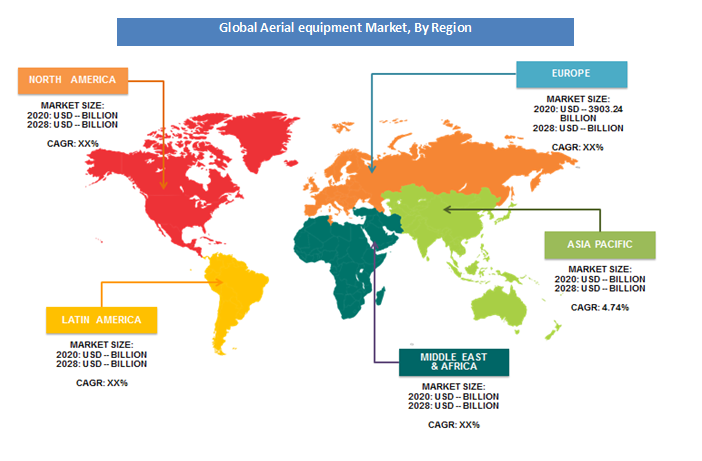
Considering all the escalating awareness of consumers in relation to the cost-effectiveness of the equipment, Asia Pacific aerial equipment market is likely to expand over the coming years, and massive funding by the government authorities in countries such as China, Malaysia, and India in Asia is expected in the coming years.
Aerial Equipment Market: Competitive Players
Some of the leading players in the market are
- Altec Industries
- Aerial Access Equipment
- Elliott Equipment Company
- Grove
- Haulotte
- JLG
- Linamar
- MEC Aerial Work Platforms
- Manitex International
- Manitou
- Nifty-lift
- Oshkosh Corporation
- Reachmaster
- Snorkel
- Terex Corporation
- Tadano
- Toyota Material Handling U.S.A(Aichi)
- and XCMG Group.
The Global Aerial Equipment Market is segmented as follows:
By Product:
- Atrium / Spider Lifts
- Boom Lifts
- Cranes
- Scissor Lifts
By Technology:
- Unpowered
- Self-propelled
- Vehicle-mounted
By Ownership:
- Rental
- End-Use Industry
By Region
- North America
- The U.S.
- Canada
- Europe
- France
- The UK
- Spain
- Germany
- Italy
- Rest of Europe
- Asia Pacific
- China
- Japan
- India
- South Korea
- Southeast Asia
- Rest of Asia Pacific
- Latin America
- Brazil
- Mexico
- Rest of Latin America
- Middle East & Africa
- GCC
- South Africa
- Rest of Middle East & Africa
Table Of Content
Methodology
FrequentlyAsked Questions
Aerial equipment refers to machinery designed to lift workers or materials to elevated heights for tasks like construction, maintenance, or inspection. Common types include aerial work platforms, boom lifts, scissor lifts, and cherry pickers, providing safety and efficiency in high-access operations.
According to study, the Aerial Equipment Market size was worth around USD 18.74 billion in 2023 and is predicted to grow to around USD 36.6 billion by 2032.
The CAGR value of Aerial Equipment Market is expected to be around 7.72% during 2024-2032.
North America has been leading the Aerial Equipment Market and is anticipated to continue on the dominant position in the years to come.
The Aerial Equipment Market is led by players like Altec Industries, Aerial Access Equipment, Elliott Equipment Company, Grove, Haulotte, JLG, Linamar, MEC Aerial Work Platforms, Manitex International, Manitou, Nifty-lift, Oshkosh Corporation, Reachmaster, Snorkel, Terex Corporation, Tadano, Toyota Material Handling U.S.A(Aichi), and XCMG Group.
HappyClients

