Viral Clearance Market Size, Share, Growth, Trends, and Forecast 2032

Viral Clearance Market Analysis By Method(Viral Removal (Chromatography, Precipitation, and Nanofiltration), Viral Inactivation (Low pH, Solvent Detergent Method, Pasteurization, and Other Viral Inactivation Methods)), By Application(Blood and Blood Products, Recombinant Proteins, Vaccines, and Other Applications), By End-User(Pharmaceutical & Biotechnology Companies, Academic Research Institutes, CROs, and Other End-Users), and By Region: Global Industry Perspective, Comprehensive Analysis, and Forecast 2024-2032
| Market Size in 2023 | Market Forecast in 2032 | CAGR (in %) | Base Year |
|---|---|---|---|
| USD 726.31 million | USD 4,011.27 million | 20.91% | 2023 |
Viral Clearance Industry Perspective:
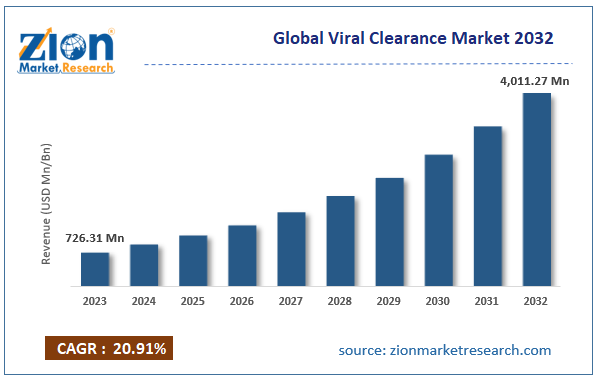
According to the report, the global viral clearance market was valued at approximately USD 726.31 million in 2023 and is expected to generate revenue of around USD 4,011.27 million by 2032, growing at a CAGR of around 20.91% between 2024 and 2032.
Key Insights
- As per the analysis shared by our research analyst, the viral clearance market is anticipated to grow at a CAGR of 20.91% during the forecast period.
- The global viral clearance market was estimated to be worth approximately USD 726.31 million in 2023 and is projected to reach a value of USD 4,011.27 million by 2032.
- The growth of the viral clearance market is being driven by the increasing demand for safe and effective biopharmaceuticals, including vaccines, monoclonal antibodies, and recombinant proteins.
- Based on the method, the viral removal segment is growing at a high rate and is projected to dominate the market.
- On the basis of application, the blood and blood products segment is projected to swipe the largest market share.
- In terms of end-user, the pharmaceutical & biotechnology companies segment is expected to dominate the market.
- By region, North America is expected to dominate the global market during the forecast period.
Viral Clearance Market Overview
In order to give the users of this report a comprehensive view of the viral clearance market, we have included a competitive landscape and an analysis of Porter’s Five Forces Model for the market. The study encompasses a market attractiveness analysis, wherein method, application, and end-user segments are benchmarked based on their market size, growth rate, and general attractiveness.
The report provides a company market share analysis to give a broader overview of the key players in the viral clearance market. In addition, the report also covers key strategic developments of the market including acquisitions & mergers, new product launches, agreements, partnerships, collaborations & joint ventures, research & development, and regional expansion of major participants involved in the viral clearance market on a global and regional basis.
Viral clearance is a crucial step in developing monoclonal antibodies, recombinant proteins, glycoproteins, tissue and blood-derived products, and medical devices. These products are susceptible to bacterial, chemical, fungal, and viral risks. Viral contamination can impact various stages, such as cell culture processes, raw materials, bioreactor contamination, and downstream processing. This underscores the need for viral safety practices and the incorporation of virus clearance processes in manufacturing.
Animal cell culture techniques are widely used for the production of biologics, such as recombinant proteins, vaccines, tissue products, etc. Microbiological safety of these products plays an important role. These products are prone to microbial contamination, such as bacteria, fungi, mycoplasma, yeasts, and viruses. Microbial contamination with bacteria, fungi, and yeasts can be easily detected. Viral contaminations pose a serious concern and require specific detection methods. Some sources of viral infection are contaminated raw materials, contaminated cell lines, GMP breakdown from the purification process, or improper cell line handling. Highly nutrient-rich medium is required for culturing animal cells. Nutrient-rich medium attracts microorganisms and their spores, and, in turn, might infect the cultured cells compromising growth and characteristics in the culture medium. This would adversely affect the quality of therapeutic products, biologics, etc.
In order to produce microbiologically safe products, viral and other contaminants need to be removed or inactivated. Viral clearance is one of the most important processes during the purification of biologics. Viruses are cleared either by removal or inactivation. Virus removal is performed via chromatography, precipitation, and nanofiltration. Viral inactivation is conducted using low pH method, solvent detergent method, pasteurization, etc.
Recombinant proteins have high potency and lesser side effects. They mimic naturally occurring proteins and, hence, are widely used worldwide. Thus, the growth is observed in the biopharmaceutical research and development field. Advances and investments made in the biotechnology and pharmaceutical industries drive the viral clearance market. Additionally, favorable research funding and government grants for product development contribute notably toward this market’s growth. The need for virus clearance in cell culture to avoid contamination, high burden of chronic disorders, and increasing aging population are also likely to contribute toward the viral clearance market. The high cost of technology and the time-consuming process of drug development might hamper this market’s growth. Growing demand for contract research organizations for pharmaceutical outsourcing along with potential emerging markets are likely to present lucrative opportunities for the viral clearance market in the upcoming years.
Viral Clearance Market Growth
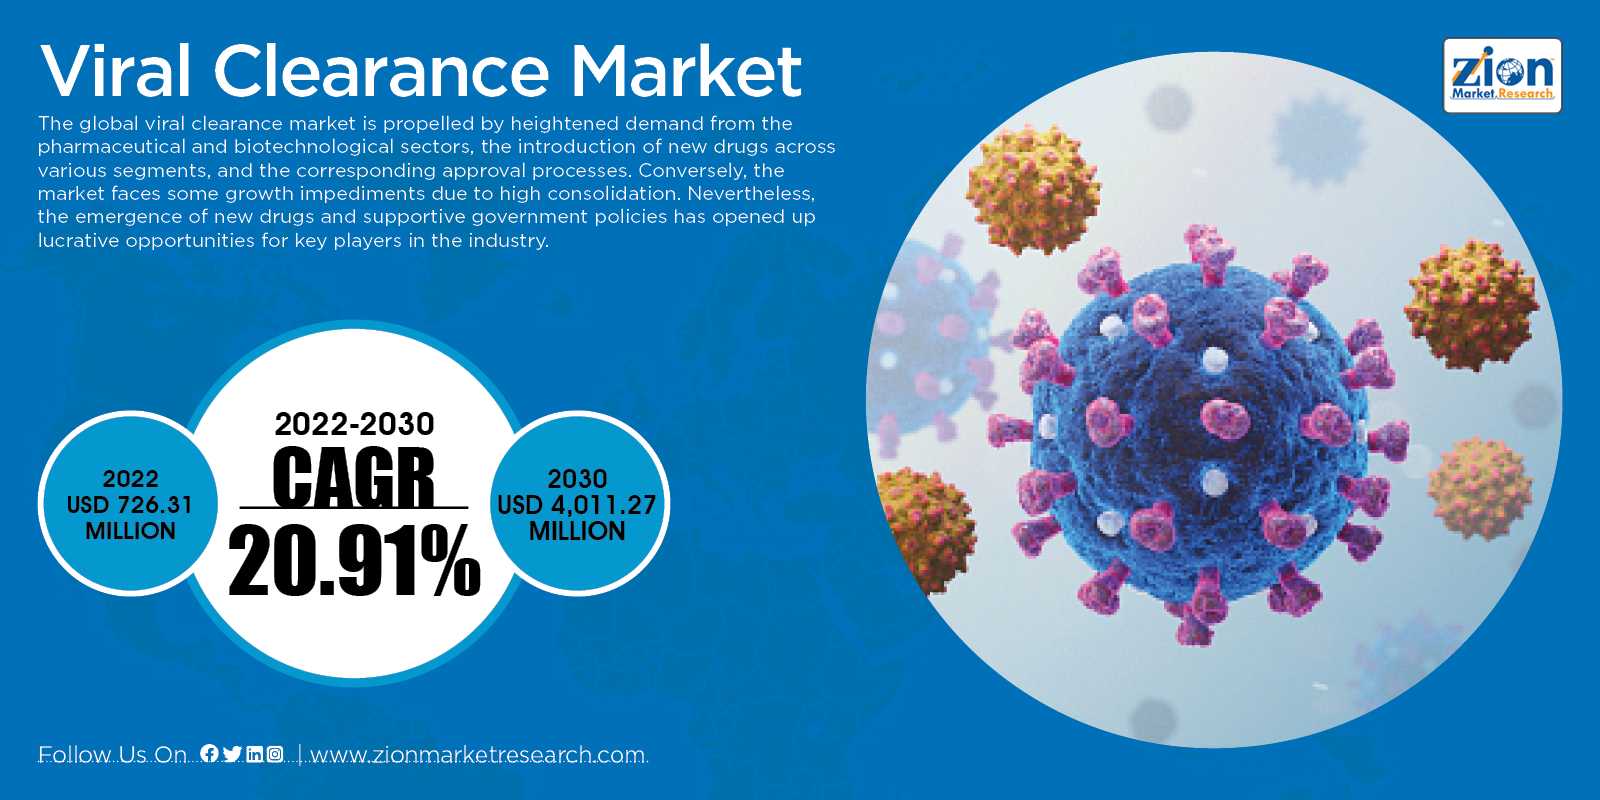
The global viral clearance market is propelled by heightened demand from the pharmaceutical and biotechnological sectors, the introduction of new drugs across various segments, and the corresponding approval processes. Conversely, the market faces some growth impediments due to high consolidation. Nevertheless, the emergence of new drugs and supportive government policies has opened up lucrative opportunities for key players in the industry.
Recent Development
- In May 2025, Northway Biotech launched full-service viral clearance studies. The new Viral Clearance Studies (VCS) are offered as both a standalone service and part of integrated CDMO programs, capturing demand for outsourced testing and significantly expanding Northway Biotech's protein-based and gene therapy service offerings, with the stated aim of delivering faster-than-industry-standard results.
- In 2024, established service providers like Eurofins publicly expanded and promoted fully cGMP viral-clearance service lines covering R&D through commercial release. It signifies a major commitment to meeting the increasingly stringent regulatory expectations for viral safety in drug products, particularly for advanced therapies like biologics and gene therapies.
- In June 2021, Charles River Laboratories completed the acquisition of Vigene Biosciences. The acquisition was a strategic expansion to broaden its gene-therapy and biologics testing footprint.
Viral Clearance Market: Report Scope
| Report Attributes | Report Details |
|---|---|
| Report Name | Viral Clearance Market |
| Market Size in 2023 | USD 726.31 Million |
| Market Forecast in 2032 | USD 4,011.27 Million |
| Growth Rate | CAGR of 20.91% |
| Number of Pages | 190 |
| Key Companies Covered | International, Inc., Lonza, Sigma-Aldrich Co., Wuxi Pharmatech (Cayman) Inc., Merck & Co., Thermo Fisher Scientific Inc., Texcell, BSL Bioservice, Avance Biosciences, SGS SA, Eurofins Scientific, General Electric, Danaher, Sartorius AG, Agilent Technologies, Bio-Rad Laboratories, Inc., F. Hoffmann-La Roche Ltd, Pfizer Inc., Hospitech, CSL Behring, Illumina, Inc., Eppendorf AG, PromoCell GmbH, HiMedia Laboratories, BD, Biospherix, Ltd, and Novogene Co., Ltd among other |
| Segments Covered | By Method, By Application, By End-User, and By Region |
| Regions Covered | North America, Europe, Asia Pacific (APAC), Latin America, Middle East, and Africa (MEA) |
| Base Year | 2023 |
| Historical Year | 2018 to 2022 |
| Forecast Year | 2024 - 2032 |
| Customization Scope | Avail customized purchase options to meet your exact research needs. Request For Customization |
Viral Clearance Market Segment Analysis
The study provides a decisive view of the viral clearance market by segmenting the market based on method, application, end-user, and region. The segments have been analyzed based on present and future trends and the market is estimated from 2018 to 2032.
By Method segment is categorized into viral removal and viral inactivation. Viral removal segment is sub-segmented into chromatography, precipitation, and nanofiltration based on virus removal technique. The viral inactivation segment is sub-segmented into low pH, solvent detergent method, pasteurization, and other viral inactivation methods. In the viral removal segment, nanofiltration held the largest market share in 2023. Chromatographic viral removal segment is expected to grow at the fastest CAGR.
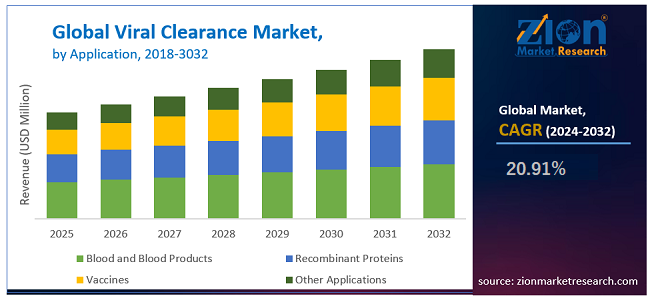
By application, the viral clearance market is segmented into blood and blood products, recombinant proteins, vaccines, and other applications. The other applications include stem cell products, cellular and gene therapy products, tissue and tissue products etc. The recombinant proteins application segment dominated the market in 2023, owing to increased production and use of biosimilars and other therapeutic proteins for treating life-threatening diseases, such as cancer, diabetes, etc., globally.
By end-user, this market includes pharmaceutical and biotechnology companies, academic research institutes, contract research organizations (CROs), and other end-users. The pharmaceutical and biotechnology companies segment dominated the viral clearance market in 2023 in terms of revenue share and is projected to lead during the forecast time period.
Viral Clearance Market: Regional Analysis
The regional segmentation includes the current and forecast demand for North America, Europe, Asia Pacific, Latin America, and the Middle East and Africa with its further bifurcation into major countries including the U.S. Canada, Germany, France, UK, China, Japan, India, and Brazil. This segmentation includes the demand for viral clearance tools based on individual segments and applications in all regions and countries.
In 2023, the leading regional market in terms of revenue share was North America. This was due to developed R&D infrastructure, growth in stem cell research, gene therapy and R&D activities in the biopharmaceutical sector act in the region. North America is likely to maintain its leading position in the forecast time period. The second largest market in terms of revenue share was Europe in 2023, due to the high acceptance of viral clearance methods for various applications, such as gene therapy, stem cell research, and biopharmaceuticals. The Asia Pacific is a rapidly growing region, due to generic manufacturing and development in India and the presence of many CROs in China and India. The Middle Eastern and African region is expected to witness a considerable rate of growth in the upcoming years. Latin America is projected to exhibit moderate growth during the forecast time period.
Some key players operating in the viral clearance market include Merck KGaA, Wuxi Biologics (Cayman), Charles River Laboratories International Inc., Kedrion, Texcell Inc., Vironova Biosafety, Clean Cells, BSL BIOSERVICE Scientific Laboratories Munich GmbH, and ViruSure GmbH, among others.
The report also includes detailed profiles of various end players, such as
- International Inc.
- Lonza
- Sigma-Aldrich Co.
- Wuxi Pharmatech (Cayman) Inc.
- Merck & Co.
- Thermo Fisher Scientific Inc.
- Texcell
- BSL Bioservice
- Avance Biosciences
- SGS SA
- Eurofins Scientific
- General Electric
- Danaher
- Sartorius AG
- Agilent Technologies
- Bio-Rad Laboratories Inc.
- F. Hoffmann-La Roche Ltd
- Pfizer Inc.
- Hospitech
- CSL Behring
- Illumina Inc.
- Eppendorf AG
- PromoCell GmbH
- HiMedia Laboratories
- BD
- Biospherix Ltd
- and Novogene Co. Ltd
This report segments the global viral clearance market as follows:
By Method
- Viral Removal
- Chromatography
- Precipitation
- Nanofiltration
- Viral Inactivation
- Low pH
- Solvent Detergent Method
- Pasteurization
- Other Viral Inactivation Methods
By Application
- Blood and Blood Products
- Recombinant Proteins
- Vaccines
- Other Applications (Stem Cell Products, Cellular & Gene Therapy Products, Tissue & Tissue Products, etc.)
By End-User
- Pharmaceutical & Biotechnology Companies
- Academic Research Institutes
- Contract Research Organizations (CROs)
- Other End-Users
By Region
- North America
- The U.S.
- Europe
- UK
- France
- Germany
- Asia Pacific
- China
- Japan
- India
- Latin America
- Brazil
- Middle East and Africa
Table Of Content
Methodology
FrequentlyAsked Questions
HappyClients

