Thermal Imaging Market Trend, Share, Size and Forecast 2032

Thermal Imaging Market By Component (Software, Hardware And Services), Application (Surveillance & Security, Maintenance & Monitoring, Automotive, Traffic Monitoring, Healthcare, And Others) For Military & Defense, Industrial, Residential, And Commercial End-Users- Global Industry Perspective, Comprehensive Analysis, Size, Share, Growth, Segment, Trends And Forecast, 2024 - 2032-
| Market Size in 2023 | Market Forecast in 2032 | CAGR (in %) | Base Year |
|---|---|---|---|
| USD 4.13 Billion | USD 7.70 Billion | 7.16% | 2023 |
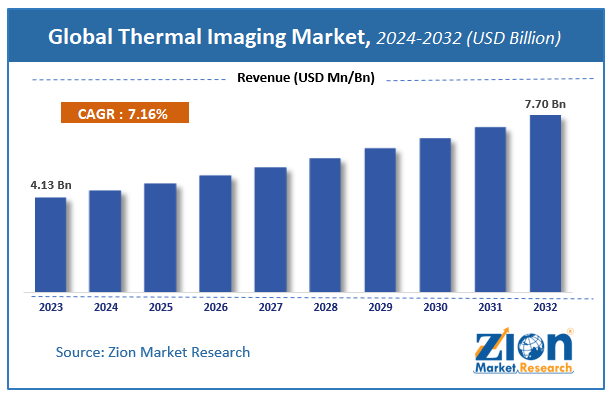
Thermal Imaging Market Size
According to Zion Market Research, the global Thermal Imaging Market was worth USD 4.13 Billion in 2023. The market is forecast to reach USD 7.70 Billion by 2032, growing at a compound annual growth rate (CAGR) of 7.16% during the forecast period 2024-2032.
The report offers a comprehensive analysis of the market, highlighting the factors that will determine growth, potential challenges, and opportunities that could emerge in the Thermal Imaging Market industry over the next decade.
Thermal Imaging Market: Overview
Thermal imaging is a non-contact technique that is employed to capture infrared wavelengths emitted through objects, further it processes these inputs into a picture. The out of this process forms a color palette that represents the temperature range of the captured image. These are completely radiometric by gauging and recording infrared wavelengths at every point within the image. Increasing demands for security and surveillance for residential and homeland security will escalate the thermal imaging market Additionally, increasing adoption of integrated solutions across commercial applications along with the utilization of thermal imaging in high-resolution cameras and smartphones would further fuel the expansion of the industry.
COVID-19 Impact Analysis:
The COVID-19 have led to stern consequences because it has deepened the expansion to a big level, and the thermal imaging market was not an exception. The demand for thermal imaging primarily depends on the residential and commercial sectors among others. The covid-19 pandemic has brought these sectors on back foot as they need to respect the loss in revenue. This is due to the closure of many small and large-scale producing facilities owing to lockdowns. However, the industry has huge growth potential and profits in the coming years.
Thermal Imaging Market: Growth Factors
Increasing demand for surveillance and security application in a public and private environment is one factor that boosts the thermal imaging market. Increased urbanization is predicted to extend the demand for extra advanced security solutions. Increasing investment in infrastructural systems alongside developing demand for surveillance is another chief factor for the market growth. In budgets, thermal cameras have been also driving the market. Increased demand for the wireless temperature sensors.
Thermal Imaging Market: Segmentation
Component Segment Analysis Preview
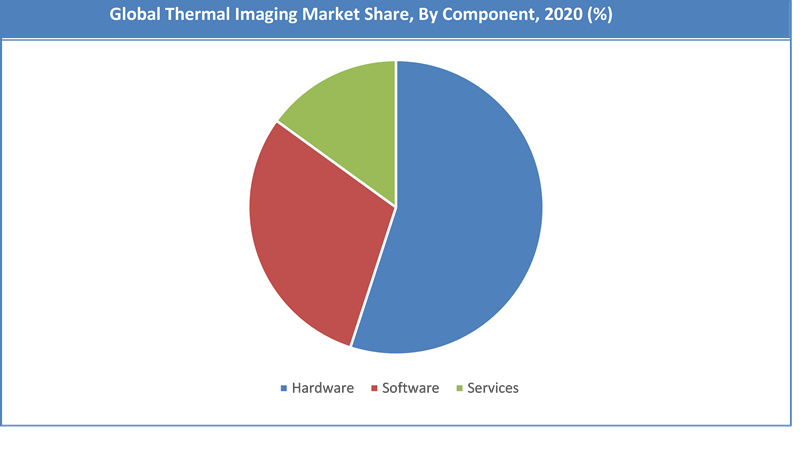
The thermal imaging market is segmented based on different components into software, hardware, and services. In 2020, hardware was the largest segment of the thermal imaging market and accounted for the largest share of the total market. The software was another key outlet for this market in the same year.
Application Segment Analysis Preview
Thermal imaging market includes the application such as surveillance and security, maintenance and monitoring, traffic monitoring, healthcare, automotive, and others. In 2020, surveillance & security, maintenance and monitoring dominated the global thermal imaging market in terms of revenue and accounted for over 45 % share of the overall market.
End-User Segment Analysis Preview
By end-user, military and defense segments dominated the market of thermal imaging, with over 40% shares of the overall market in 2018. The Industrial segment was the second-largest application of the thermal imaging market. The residential & industrial segment is expected to exhibit considerable growth in the next few years due to the availability of low-cost devices.
Thermal Imaging Market: Report Scope
| Report Attributes | Report Details |
|---|---|
| Report Name | Thermal Imaging Market |
| Market Size in 2023 | USD 4.13 Billion |
| Market Forecast in 2032 | USD 7.70 Billion |
| Growth Rate | CAGR of 7.16% |
| Number of Pages | 142 |
| Key Companies Covered | Flir Systems, Danaher, L-3 Communications Holdings, Inc., Drs Technologies, Raytheon, Bullard, BAE Systems Inc., Axis, Thermoteknix, Sofradir Group, Testo Ag, CI Infrared Cameras, Inc., Nippon Avionics Co. Ltd., Honeywell International, Inc., and Infratec |
| Segments Covered | By Application, By Component, By End-User and By Region |
| Regions Covered | North America, Europe, Asia Pacific (APAC), Latin America, Middle East, and Africa (MEA) |
| Base Year | 2023 |
| Historical Year | 2018 to 2022 |
| Forecast Year | 2024 - 2032 |
| Customization Scope | Avail customized purchase options to meet your exact research needs. Request For Customization |
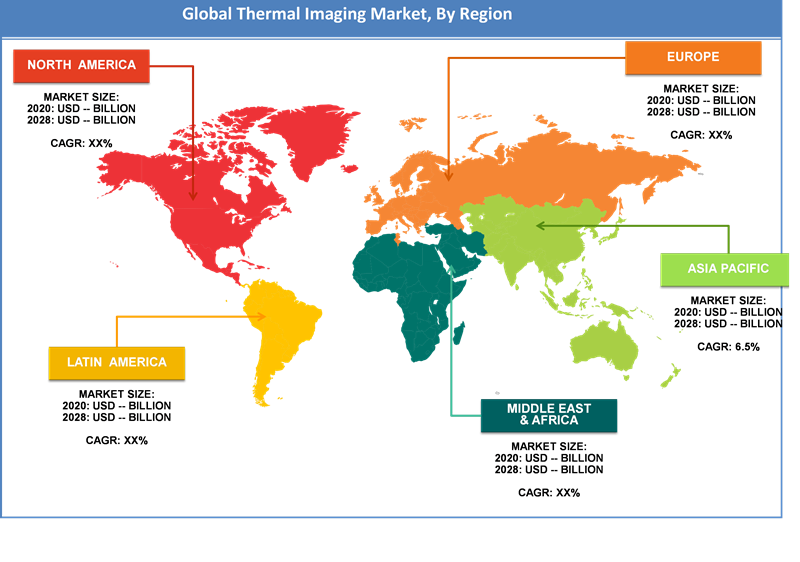
Thermal Imaging Market: Regional Analysis
Demand for thermal imaging was highest in North America, with around 30% of the market share in 2020. North America was followed by Europe and Asia-Pacific in terms of demand. In terms of revenue, Asia Pacific was the fastest-growing region within the forecast period. Europe is predicted to grow at a moderate rate due to the increased adoption of thermal imaging devices for commercial security and enforcement activities.
Thermal Imaging Market: Competitive Players
Some of the key players in the thermal imaging market include:
- Flir Systems
- Danaher
- L-3 Communications Holdings Inc.
- Drs Technologies
- Raytheon
- Bullard
- BAE Systems Inc.
- Axis
- Thermoteknix
- Sofradir Group
- Testo Ag
- CI Infrared Cameras Inc.
- Nippon Avionics Co. Ltd.
- Honeywell International Inc.
- Infratec.
The global Thermal Imaging Market is segmented as follows:
By Application
- Surveillance & Security
- Maintenance &Monitoring
- Automotive
- Traffic Monitoring
- Healthcare
- Others
By Component
- Hardware
- Software
- Services
By End-User
- Military & Defense
- Commercial
- Residential
- Industrial
By Region
- North America
- The U.S.
- Canada
- Europe
- France
- The UK
- Spain
- Germany
- Italy
- Rest of Europe
- Asia Pacific
- China
- Japan
- India
- South Korea
- Southeast Asia
- Rest of Asia Pacific
- Latin America
- Brazil
- Mexico
- Rest of Latin America
- Middle East & Africa
- GCC
- South Africa
- Rest of Middle East & Africa
Table Of Content
Methodology
FrequentlyAsked Questions
Thermal imaging is a technology that captures and visualizes infrared radiation (heat) emitted by objects, creating images based on temperature differences. It is widely used in applications like surveillance, medical diagnostics, building inspections, and industrial maintenance.
According to study, the Thermal Imaging Market size was worth around USD 4.13 billion in 2023 and is predicted to grow to around USD 7.70 billion by 2032.
The CAGR value of Thermal Imaging Market is expected to be around 7.16% during 2024-2032.
North America has been leading the Thermal Imaging Market and is anticipated to continue on the dominant position in the years to come.
The Thermal Imaging Market is led by players like Flir Systems, Danaher, L-3 Communications Holdings, Inc., Drs Technologies, Raytheon, Bullard, BAE Systems Inc., Axis, Thermoteknix, Sofradir Group, Testo Ag, CI Infrared Cameras, Inc., Nippon Avionics Co. Ltd., Honeywell International, Inc., and Infratec
HappyClients

