Global Point-Of-Sale (POS) Terminals Market Size, Share, Growth Analysis Report - Forecast 2034

Point-Of-Sale (POS) Terminals Market By Product (Fixed (Kiosks, Others), Mobile (Tablet, Others)), By Component (Hardware, Software, Services), By Deployment (Cloud, On-premise), By End-use (Restaurants, Retail, Hospitality, Healthcare, Warehouse, Entertainment, Others), and By Region: Global and Regional Industry Overview, Market Intelligence, Comprehensive Analysis, Historical Data, and Forecasts 2025 - 2034
| Market Size in 2024 | Market Forecast in 2034 | CAGR (in %) | Base Year |
|---|---|---|---|
| USD 99.56 Billion | USD 199.55 Billion | 7.2% | 2024 |
Point-Of-Sale (POS) Terminals Market: Industry Perspective
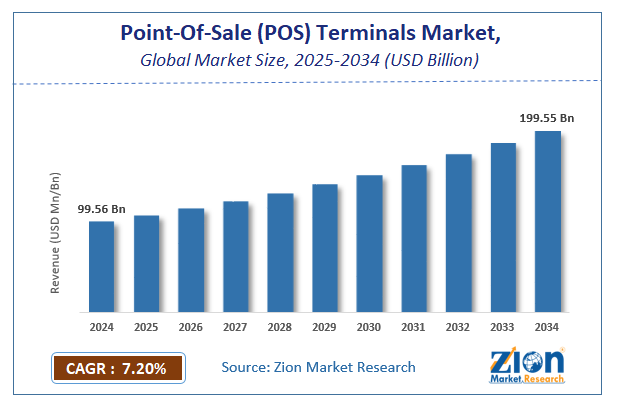
The global point-of-sale (POS) terminals market size was worth around USD 99.56 Billion in 2024 and is predicted to grow to around USD 199.55 Billion by 2034 with a compound annual growth rate (CAGR) of roughly 7.2% between 2025 and 2034.
The report analyzes the global point-of-sale (POS) terminals market's drivers, restraints/challenges, and the effect they have on the demands during the projection period. In addition, the report explores emerging opportunities in the point-of-sale (POS) terminals industry.
Point-Of-Sale (POS) Terminals Market: Overview
Point of Sale (POS) terminals is a hardware and software combined machine that permits easier transactions for merchants and customers. These POS terminals are equipment that performs sales transactions and card payment processing. They are generally utilized in business operations and are combined with computer terminals to accomplish daily operations. The terminals are used for a variety of functions like customer analysis, financial transaction management, and inventory management, among others.
Increasing government initiatives toward promoting a cashless economy are likely to impact market expansion. For instance, the Singapore government’s Smart Nation initiative aims at achieving a cashless economy and promoting mobile payments. The Monetary Authority of Singapore has been working toward the development of a Unified Point-of-Sale (UPOS) terminal, allowing a merchant to simply accept cashless payments including contactless or mobile payments. Similarly, the Digital India program of the Indian government aims to rework India into a cashless and digitally empowered economy.
Key Insights
- As per the analysis shared by our research analyst, the global point-of-sale (POS) terminals market is estimated to grow annually at a CAGR of around 7.2% over the forecast period (2025-2034).
- Regarding revenue, the global point-of-sale (POS) terminals market size was valued at around USD 99.56 Billion in 2024 and is projected to reach USD 199.55 Billion by 2034.
- The point-of-sale (POS) terminals market is projected to grow at a significant rate due to rapid adoption of digital payments, e-commerce growth, and the need for efficient transaction management.
- Based on Product, the Fixed (Kiosks segment is expected to lead the global market.
- On the basis of Component, the Hardware segment is growing at a high rate and will continue to dominate the global market.
- Based on the Deployment, the Cloud segment is projected to swipe the largest market share.
- By End-use, the Restaurants segment is expected to dominate the global market.
- Based on region, Asia-Pacific is predicted to dominate the global market during the forecast period.
Point-Of-Sale (POS) Terminals Market: Dynamics
Toshiba Corporation, Hewlett-Packard Company, Samsung company Ltd, and VeriFone Systems Incorporation are a number of the key vendors of point of sale terminals across the planet. These players across the point of sale (POS) terminals market are focusing aggressively on innovation, also as on including advanced technologies in their existing products. Over the approaching years, they're also expected to require up partnerships and mergers & acquisitions as their key strategy for business development states the point of sale (POS) terminals market study.
The point of sale (POS) terminal is a combination of hardware and software which allows retail locations to accept card payments without updating cash registers to read cards directly. It is an electronic device that is used to process card payment at any retail location. Installation cost of point of sale terminals depends on the size of the business. Small business merchants may have to pay rent for the terminal along with an additional fee on per transaction.
POS read information of customer’s credit and debit card then check whether sufficient fund is available in the account or not. After that transfer, the fund from customer’s account to seller’s account and then records the transaction and provides a print receipt. POS terminal offers various benefits such as simplification of the accounting process, easy to look up past transactions, the creation of purchase orders, old fashioned faster old-fashioned cash registers, It also helps to cut down on user errors. These different benefits offered by POS terminals are the key drivers of this market growth. Additionally, high adoption of POS terminal in many sectors such as retail, healthcare, warehouse/distribution, government, manufacturing, and others help to drive the point-of-sale terminal market. However, security concern associated with this technology can impact the growth of the market.
Point-Of-Sale (POS) Terminals Market: Growth Drivers
The thriving e-commerce sector and growing trend among the end-users to travel for cashless online financial transactions are projected to get more demand for point of sale terminals over the approaching years. Apart from this, mounting product preferences across myriad sectors like healthcare, manufacturing, retail, government, and warehouse are anticipated to reinforce the point of sale (POS) terminals market scope over the years to return. Increasing security concerns and low product awareness among the tiny businesses can destructively influence the POS terminals market development within the years ahead.
Point-Of-Sale (POS) Terminals Market: Segmentation Analysis
The global point-of-sale (POS) terminals market is segmented based on Product, Component, Deployment, End-use, and region.
Based on product, the fixed product segment dominated the market and accounted for more than 60% of the worldwide revenue share in 2020. Fixed POS terminals are preferred mainly by large-scale vendors thanks to high procurement and installation costs, which have currently contributed to the market growth. The mPOS segment is predicted to expand at the fastest CAGR from 2021 to 2028. These terminals allow simple payments during busy hours, avoiding loss of sales thanks to delays, and help in improving customer satisfaction.
By component, the POS system hardware and software are improved and upgraded over years to make sure secure transactions and portability. POS providers have increased investments in end-to-end encryption technology to secure payment gateways that might build customer trust and help in impelling the merchandise demand. Additionally, multifunctional software integrated with a POS system would offer safe payment, customer data analysis, and employee information storage facility to the end-user. The merchandise demand is additionally boosted by its capability to act as a strong employee management tool to watch employee performance and create a contented workforce.
By Deployment, the global point-of-sale (POS) terminals market is split into Cloud, On-premise.
In terms of End-use, the global point-of-sale (POS) terminals market is categorized into Restaurants, Retail, Hospitality, Healthcare, Warehouse, Entertainment, Others.
Point-Of-Sale (POS) Terminals Market: Report Scope
| Report Attributes | Report Details |
|---|---|
| Report Name | Point-Of-Sale (POS) Terminals Market |
| Market Size in 2024 | USD 99.56 Billion |
| Market Forecast in 2034 | USD 199.55 Billion |
| Growth Rate | CAGR of 7.2% |
| Number of Pages | 150 |
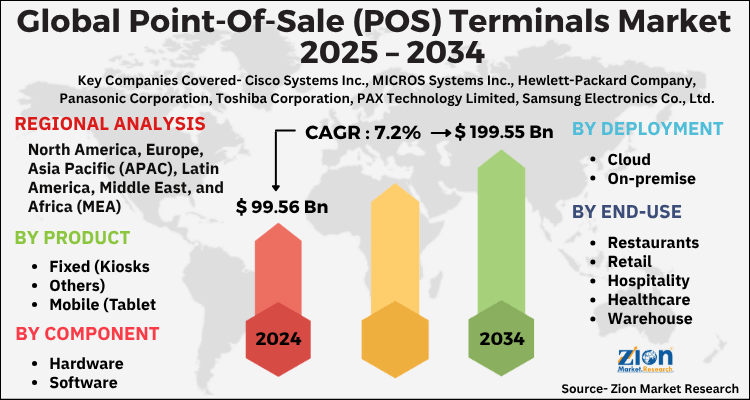
| Key Companies Covered | Cisco Systems Inc., MICROS Systems Inc., Hewlett-Packard Company, Panasonic Corporation, Toshiba Corporation, PAX Technology Limited, Samsung Electronics Co., Ltd., NEC Corporation, VeriFone Systems Inc, and others, and others. |
| Segments Covered | By Product, By Component, By Deployment, By End-use, and By Region |
| Regions Covered | North America, Europe, Asia Pacific (APAC), Latin America, The Middle East and Africa (MEA) |
| Base Year | 2024 |
| Historical Year | 2020 to 2023 |
| Forecast Year | 2025 - 2034 |
| Customization Scope | Avail customized purchase options to meet your exact research needs. Request For Customization |
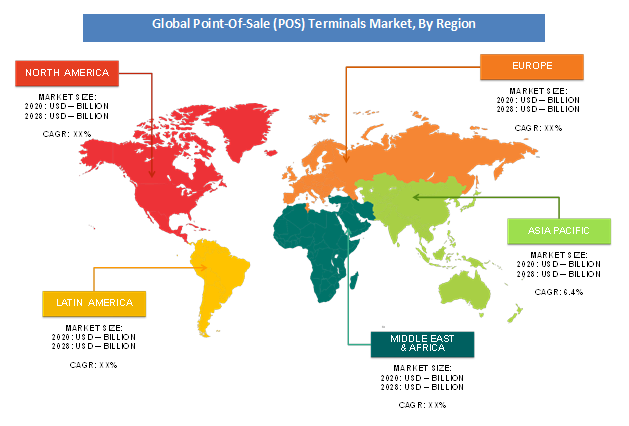
Point-Of-Sale (POS) Terminals Market: Regional Analysis
Based on region, North America has been leading the global point of sale (POS) terminals market and is anticipated to continue in the dominant position in the years to come, states the point of sale (POS) terminals market study. The rising demand for the product in retail and entertainment sectors along with the rise in adoption of this payment technology in the region is the main factor behind the dominance of the North America POS terminals market.
Point-Of-Sale (POS) Terminals Market: Competitive Analysis
The report provides a company market share analysis to give a broader overview of the key market players. In addition, the report also covers key strategic developments of the market, including acquisitions & mergers, new product launches, agreements, partnerships, collaborations & joint ventures, research & development, and regional expansion of major participants involved in the point-of-sale (POS) terminals market on a global and regional basis.
The global point-of-sale (POS) terminals market is dominated by players like:
- Cisco Systems Inc.
- MICROS Systems Inc.
- Hewlett-Packard Company
- Panasonic Corporation
- Toshiba Corporation
- PAX Technology Limited
- Samsung Electronics Co. Ltd.
- NEC Corporation
- VeriFone Systems Inc
- and others
The global point-of-sale (POS) terminals market is segmented as follows;
By Product
- Fixed (Kiosks
- Others)
- Mobile (Tablet
- Others)
By Component
- Hardware
- Software
- Services
By Deployment
- Cloud
- On-premise
By End-use
- Restaurants
- Retail
- Hospitality
- Healthcare
- Warehouse
- Entertainment
- Others
By Region
- North America
- The U.S.
- Canada
- Mexico
- Europe
- France
- The UK
- Spain
- Germany
- Italy
- Rest of Europe
- Asia Pacific
- China
- Japan
- India
- Australia
- South Korea
- Rest of Asia Pacific
- The Middle East & Africa
- Saudi Arabia
- UAE
- Egypt
- Kuwait
- South Africa
- Rest of the Middle East & Africa
- Latin America
- Brazil
- Argentina
- Rest of Latin America
Table Of Content
Methodology
FrequentlyAsked Questions
The Global point-of-sale (POS) terminals market is expected to grow due to rapid adoption of digital payments, e-commerce growth, and the need for efficient transaction management.
According to a study, the Global point-of-sale (POS) terminals market size was worth around USD 99.56 Billion in 2024 and is expected to reach USD 199.55 Billion by 2034.
The Global point-of-sale (POS) terminals market is expected to grow at a CAGR of 7.2% during the forecast period.
Asia-Pacific is expected to dominate the point-of-sale (POS) terminals market over the forecast period.
Leading players in the Global point-of-sale (POS) terminals market include Cisco Systems Inc., MICROS Systems Inc., Hewlett-Packard Company, Panasonic Corporation, Toshiba Corporation, PAX Technology Limited, Samsung Electronics Co., Ltd., NEC Corporation, VeriFone Systems Inc, and others, among others.
The report explores crucial aspects of the point-of-sale (POS) terminals market, including a detailed discussion of existing growth factors and restraints, while also examining future growth opportunities and challenges that impact the market.
HappyClients

