Pest Control Market Size Report, Industry Share, Analysis, Growth 2032

Pest Control Market By Type (Mechanical Control, Chemical Control, Biological Control and Others), By Pest Type (Termites, Insects, Wildlife, Rodents and Others), By Application (Industrial, Commercial, Agricultural, Residential and Others) and By End Use Industry (Manufacturers, Farmers, Pest Control Service Providers, Suppliers, R&D Institutes, Pesticides Manufacturers, Whole sellers, Government and Research Organizations and Others): Global Industry Perspective, Comprehensive Analysis and Forecast, 2024 - 2032
| Market Size in 2023 | Market Forecast in 2032 | CAGR (in %) | Base Year |
|---|---|---|---|
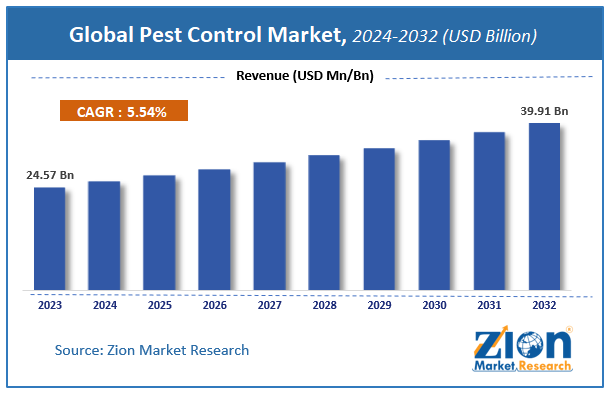
| USD 24.57 Billion | USD 39.91 Billion | 5.54% | 2023 |
Global Pest Control Market Insights
According to a report from Zion Market Research, the global Pest Control Market was valued at USD 24.57 Billion in 2023 and is projected to hit USD 39.91 Billion by 2032, with a compound annual growth rate (CAGR) of 5.54% during the forecast period 2024-2032. This report explores market strengths, weakness, opportunities, and threats. It also provides valuable insights into the market's growth drivers, challenges, and the future prospects that may emerge in the Pest Control Market industry over the next decade.
Pest Control Market Overview
Pest Control is a process of managing and regulating the spread of pests by application of physical, chemical and biological methods. Pests are undesirable organisms that has potential to affect human health. Most commonly found pests in residential and commercial areas are mosquito, bedbugs, termites, worms and rodents such as rats, mice and other. The market for pest control is driven by the rise in urban populations across the globe which has led to an increase in the safety of food sources and living habitats and has led to a rising concern to manage cockroaches, rodents and mosquitoes and other pests.
Growth Factors
Rising consciousness about health and hygiene especially from the residential and commercial sectors is enabling people for rising adoption of pest control products and services across the globe. Growing economic activities, increasing population, increasing awareness about various ill effects caused by pest with intolerance for pests is driving the growth of market. The changes in way food are produced, manufactured or distributed along with the climate changes have led to increasing risks of pest and this has in turn led to an increase in demand for pest control services. Government has also been involved in stringent regulation and implementation for pest control for food safety.
Pest Control is widely used in the agricultural sector to enhance crop yield and to enhance the quality crops with application of chemical fertilizers, pesticides and other factors. Technological advancement in field of pest control has also led to an increased productivity in the last decade. Moreover, there has been a rising focus on the usage of biocides that are being extremely used to replace traditional pesticides and are environmentally friendly is also one of the factors for the market growth.
Global Pest Control Market: Segmentation
The study provides a decisive view of the E-bike Market by segmenting the market based on by type, by pest type, by application, by end use industry and by region. All the segments have been analyzed based on present and future trends and the market is estimated from 2024 to 2032.
By type segment analysis includes mechanical control, chemical control, biological control, others. Insect segment will grow at a CAGR of over 5.54% from 2024 to 2032. This is attributable to the serious threat posed by insects to agricultural and non-agricultural areas, and stringent control measure are necessary to eradicate them. The segment is growing significantly due to the growing number of insects, especially bed bugs. The demand for insect control is anticipated to increase in developing regions and in countries with warm and humid climate condition as such climatic conditions are ideal for breeding of a number of insects.
The rising number of rats and mice and increasing awareness about the diseases caused by them is expected to drive the growth of rodent’s pest segment. Even the termite segment is expected to register highest growth rate in the forecast period.
By pest type segment analysis includes termites, insects, wildlife, rodents, others.
By application segment analysis includes industrial, commercial, agricultural, residential, others. The Commercial segment held a share of more than 43.67% in 2023. This is attributable to rising economic activities and limited tolerance for pests in commercial areas such as offices, hospitals, foodservice industries, food and beverages etc. The growth of this segment is also attributable to the increasing infrastructure in commercial space with strict regulation for hygiene maintenance and increasing urbanization. Governmental support in terms of various commercial pest control management programs and high affordability of pest control management services is expected to drive the segment growth in the forecast period.
The residential segment is also expected to show robust growth in near future with the increasing number of houses and rising prevalence of pest such as cockroaches, rodents and ants.
By end use industry segment analysis includes manufacturers, farmers, pest control service providers, suppliers, r&d institutes, pesticides manufacturers, whole sellers, government and research organizations, others.
The regional segment includes the current and forecast demand for North America, Europe, Asia Pacific, Latin America, and the Middle East and Africa.
The Asia Pacific region held a CAGR of more than 4.78% in 2023. This is attributable to the increasing pest risks within the entire supply chain of Asian region. Termites and mosquito are significant threats but other pests like ants, cockroaches, rodents and insects are of major concern. To overcome these pest risks large food-related businesses are sharing responsibility of pest control. The surge in consumers expenditure and awareness about the toxicity caused by pests is expected to drive the market growth during the forecast period. Maximum revenue in Asia Pacific is generated through Japan. Moreover, having high potential is expected to increase the interest of key market players in this region which is responsible for market to grow in the forecast period.
The North American region has the highest market share of more than 37.8% in 2023 and is expected to show high growth rate during the forecast period. This is attributable to the increasing and high awareness about ill effects on health and economic losses caused by pest attacks. It has been reported that around more than 26% of all Americans have at some or the other point experienced a rodent pest issue. The regional market is also driven by the increasing number of commercial and residential construction in prominent economies such as US and Canada. Moreover, there is presence of major companies in this region such as Terminix, Rollins, Inc, ServiceMaster and others which is fueling the growth of market in North America.
Pest Control Market: Report Scope
| Report Attributes | Report Details |
|---|---|
| Report Name | Pest Control Market |
| Market Size in 2023 | USD 24.57 Billion |
| Market Forecast in 2032 | USD 39.91 Billion |
| Growth Rate | CAGR of 5.54% |
| Number of Pages | 186 |
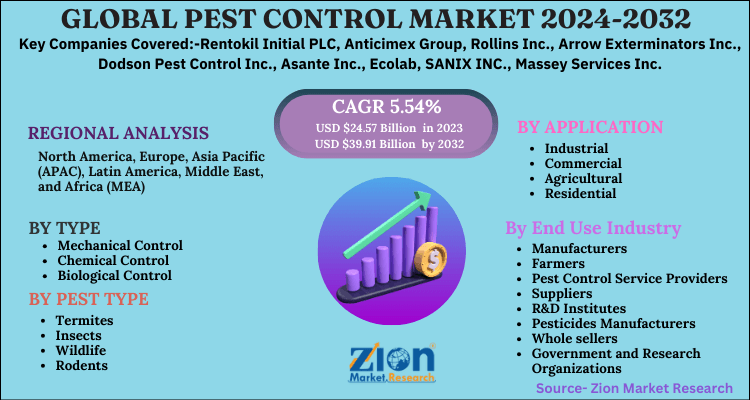
| Key Companies Covered | Rentokil Initial PLC, Anticimex Group, Rollins Inc., Arrow Exterminators Inc., Dodson Pest Control Inc., Asante Inc., Ecolab, SANIX INC., Massey Services Inc |
| Segments Covered | By Type, By Pest Type, By Application, By End Use Industry and By Region |
| Regions Covered | North America, Europe, Asia Pacific (APAC), Latin America, Middle East, and Africa (MEA) |
| Base Year | 2023 |
| Historical Year | 2018 - 2022 |
| Forecast Year | 2024 - 2032 |
| Customization Scope | Avail customized purchase options to meet your exact research needs. Request For Customization |
Key Market Players & Competitive Landscape
Some of key players in Pest Control market are-
- Rentokil Initial PLC
- Anticimex Group
- Rollins Inc
- Arrow Exterminators Inc
- Dodson Pest Control Inc
- Asante Inc
- Ecolab
- SANIX INC
- Massey Services Inc
The global Pest Control market is segmented as follows:
By Type
- Mechanical Control
- Chemical Control
- Biological Control
- Others
By Pest Type
- Termites
- Insects
- Wildlife
- Rodents
- Others
By Application
- Industrial
- Commercial
- Agricultural
- Residential
- Others
By End Use Industry
- Manufacturers
- Farmers
- Pest Control Service Providers
- Suppliers
- R&D Institutes
- Pesticides Manufacturers
- Whole sellers
- Government and Research Organizations
- Others
By Region
- North America
- The U.S.
- Canada
- Mexico
- Europe
- France
- The UK
- Spain
- Germany
- Italy
- Rest of Europe
- Asia Pacific
- China
- Japan
- India
- Australia
- South Korea
- Rest of Asia Pacific
- The Middle East & Africa
- Saudi Arabia
- UAE
- Egypt
- Kuwait
- South Africa
- Rest of the Middle East & Africa
- Latin America
- Brazil
- Argentina
- Rest of Latin America
Table Of Content
Methodology
FrequentlyAsked Questions
The Global Pest Control Market was valued at USD 24.57 Billion in 2023.
The Global Pest Control Market is expected to reach more than USD 24.57 Billion in 2023 and is projected to hit USD 39.91 Billion by 2032, with a compound annual growth rate (CAGR) of 5.54% during the forecast period 2024-2032.
Rising consciousness about health and hygiene especially from the residential and commercial sectors is enabling people for rising adoption of pest control products and services across the globe. Growing economic activities, increasing population, increasing awareness about various ill effects caused by pest with intolerance for pests is driving the growth of market. The changes in way food are produced, manufactured or distributed along with the climate changes have led to increasing risks of pest and this has in turn led to an increase in demand for pest control services.
The Asia Pacific region held a CAGR of more than 4.78% in 2020. This is attributable to the increasing pest risks within the entire supply chain of Asian region. Termites and mosquito are significant threats but other pests like ants, cockroaches, rodents and insects are of major concern. To overcome these pest risks large food-related businesses are sharing responsibility of pest control.
Some of key players in Pest Control market are Rentokil Initial PLC, Anticimex Group, Rollins Inc., Arrow Exterminators Inc., Dodson Pest Control Inc., Asante Inc., Ecolab, SANIX INC., Massey Services Inc.
HappyClients

