Nutrition Bars Market Size, Share, Trends, Growth and Forecast 2032

Nutrition Bars Market by Product (Protein Bars, Energy Bars, Meal Replacement Bars, and Others), By Type (Organic and Conventional), By Distribution Channel (Supermarkets & Hypermarkets, Convenience Stores, Online, and Others): Global Industry Perspective, Comprehensive Analysis and Forecast, 2024 - 2032-
| Market Size in 2023 | Market Forecast in 2032 | CAGR (in %) | Base Year |
|---|---|---|---|
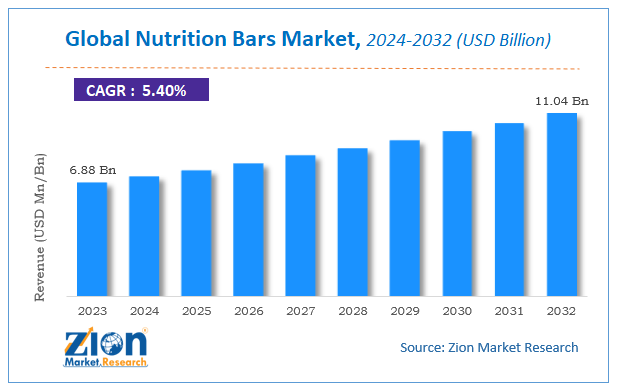
| USD 6.88 Billion | USD 11.04 Billion | 5.4% | 2023 |
Nutrition Bars Market Insights
According to Zion Market Research, the global Nutrition Bars Market was worth USD 6.88 Billion in 2023. The market is forecast to reach USD 11.04 Billion by 2032, growing at a compound annual growth rate (CAGR) of 5.4% during the forecast period 2024-2032.
The report offers a comprehensive analysis of the market, highlighting the factors that will determine growth, potential challenges, and opportunities that could emerge in the Nutrition Bars industry over the next decade.
Global Nutrition Bars Market: Overview
A nutrition bar offers various health benefits to the consumers as they are composed of conventional and organic constituents. Nutrition bars incorporate numerous constituents that include protein, calcium, fiber, and others.
Global Nutrition Bars Market: Growth Factors
The demand for nutrition bars has increased due to the rising health and wellness awareness among the people, growing preference for functional foods, increasing awareness for healthy diet, and rising adoption of organic nutrition bars at fitness centers. Moreover, distribution of nutrition bars over various online channels is anticipated to propel the market demand over the forecast period.
Nutrition bars satisfy the diet requirements of a huge customer base that is engaged in fitness as a profession. Moreover, customers are willing to pay more for food that have a high nutritional value, which is accelerating the sales of nutrition bars. Furthermore, nutrition bars are considered as one of the best alternatives for food that helps in satisfying the energy demands of customers.
Nutrition Bars Market Dynamics
Market Drivers:
The Nutrition Bars Market is driven by several factors that contribute to its growth and development. One of the key drivers is the increasing health consciousness among consumers. With a growing focus on personal well-being and fitness, individuals are actively seeking out healthier food options. Nutrition bars provide a convenient and nutritious solution, offering a balanced combination of proteins, carbohydrates, and essential vitamins and minerals. Government initiatives promoting healthy lifestyles and combating obesity also play a significant role in driving the market. For instance, in recent years, various governments have implemented policies to encourage healthy eating habits and combat the rising prevalence of obesity. These initiatives create awareness and promote the consumption of nutritious food alternatives such as nutrition bars. Furthermore, the demand for convenience is a strong driver in this market. Modern lifestyles are becoming increasingly hectic, with individuals often seeking quick and on-the-go food options. Nutrition bars fit perfectly into this lifestyle, providing a convenient and portable source of nutrition. This demand for convenience is expected to continue fueling the growth of the nutrition bars market.
Global Nutrition Bars Market: Segmentation
The global nutrition bars market is segmented on the basis of product, type, and distribution channel. Based on the product, the market is further divided into protein bars, energy bars, meal replacement bars, and others. On the basis of type, the nutrition bars market comprises of organic and conventional. Based on distribution channel, the market is further bifurcated into supermarkets & hypermarkets, convenience stores, online, and others.
Nutrition Bars Market: Report Scope
| Report Attributes | Report Details |
|---|---|
| Report Name | Nutrition Bars Market |
| Market Size in 2023 | USD 6.88 Billion |
| Market Forecast in 2032 | USD 11.04 Billion |
| Growth Rate | CAGR of 5.4% |
| Number of Pages | 110 |
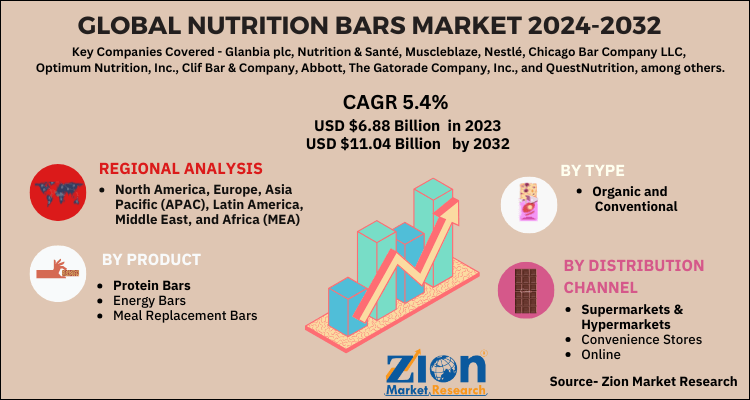
| Key Companies Covered | Glanbia plc, Nutrition & Santé, Muscleblaze, Nestlé, Chicago Bar Company LLC, Optimum Nutrition, Inc., Clif Bar & Company, Abbott, The Gatorade Company, Inc., and QuestNutrition, among others |
| Segments Covered | By Product, By Type, By Distribution Channel And By Region |
| Regions Covered | North America, Europe, Asia Pacific (APAC), Latin America, Middle East, and Africa (MEA) |
| Base Year | 2023 |
| Historical Year | 2018 to 2022 |
| Forecast Year | 2024 - 2032 |
| Customization Scope | Avail customized purchase options to meet your exact research needs. Request For Customization |
Global Nutrition Bars Market: Regional Analysis
Based on regions, the global nutrition bars market can be divided into five main regions: North America, Europe, Asia Pacific, Latin America, and the Middle East and Africa. The North America region captured a substantial share in 2019. The U.S. is the major contributor in terms of revenue. This is attributable to the presence of major companies such as Chicago Bar Company LLC, The Gatorade Company, Inc., and Abbott, among others.
The Asia Pacific region is anticipated to grow at a considerable rate over the forecast period. This is due to the rising health and fitness awareness among people of developing economies such as China and India. Moreover, the Indian government is also taking initiatives to promote fitness and healthy lifestyle among the citizens of the country. For instance, in 2019, the government of India launched “Fit India Movement” to promote fitness. This is anticipated to augment the market growth over the forecast period.
Global Nutrition Bars Market: Competitive Players
Some of key players in nutrition bars market are -
- Glanbia plc
- Nutrition & Santé
- Muscleblaze
- Nestlé
- Chicago Bar Company LLC
- Optimum Nutrition
- Clif Bar & Company
- Abbott
- The Gatorade Company
- QuestNutrition
- among others.
The global nutrition bars market is segmented as follows:
By Product
- Protein Bars
- Energy Bars
- Meal Replacement Bars
- Others
By Type
- Organic and Conventional
By Distribution Channel
- Supermarkets & Hypermarkets
- Convenience Stores
- Online
- Others
Global Nutrition Bars Market: Regional Segment Analysis
- North America
- The U.S.
- Canada
- Europe
- France
- The UK
- Spain
- Germany
- Italy
- Rest of Europe
- Asia Pacific
- China
- Japan
- India
- South Korea
- Southeast Asia
- Rest of Asia Pacific
- Latin America
- Brazil
- Mexico
- Rest of Latin America
- Middle East & Africa
- GCC
- South Africa
- Rest of Middle East & Africa
Table Of Content
Methodology
FrequentlyAsked Questions
HappyClients

