Global Natural Food Color Market Size, Share, Growth Analysis Report - Forecast 2034

Natural Food Color Market By Ingredient (Beta-carotene, Lycopene, Curcumin, Anthocyanin, Carmine, Copper Chlorophyllin, Paprika, Betanin, Riboflavin, Blue Spirulina, Caramel, Annatto, Others), By Application (Bakery & Confectionery, Beverages, Dairy & Frozen Products, Meat Products, Oils & Fats, Fruits & Vegetables, Meat Alternatives/ Plant-based Meat, Pet Food), and By Region: Global and Regional Industry Overview, Market Intelligence, Comprehensive Analysis, Historical Data, and Forecasts 2025 - 2034
| Market Size in 2024 | Market Forecast in 2034 | CAGR (in %) | Base Year |
|---|---|---|---|
| USD 3.99 Billion | USD 5.30 Billion | 2.9% | 2024 |
Natural Food Color Market: Industry Perspective
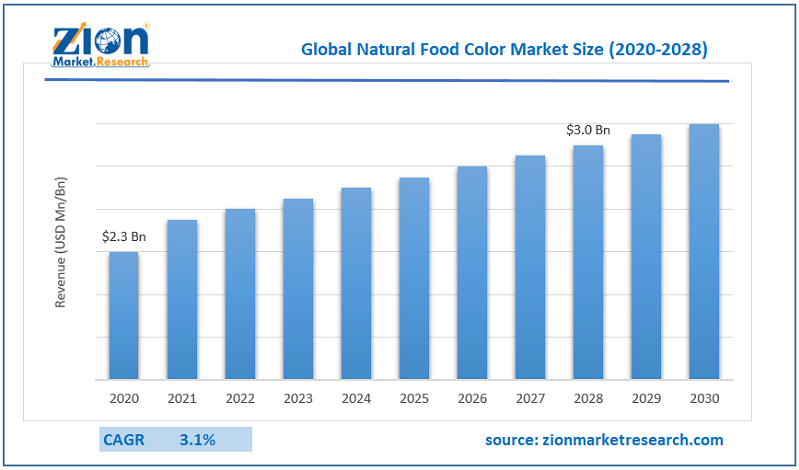
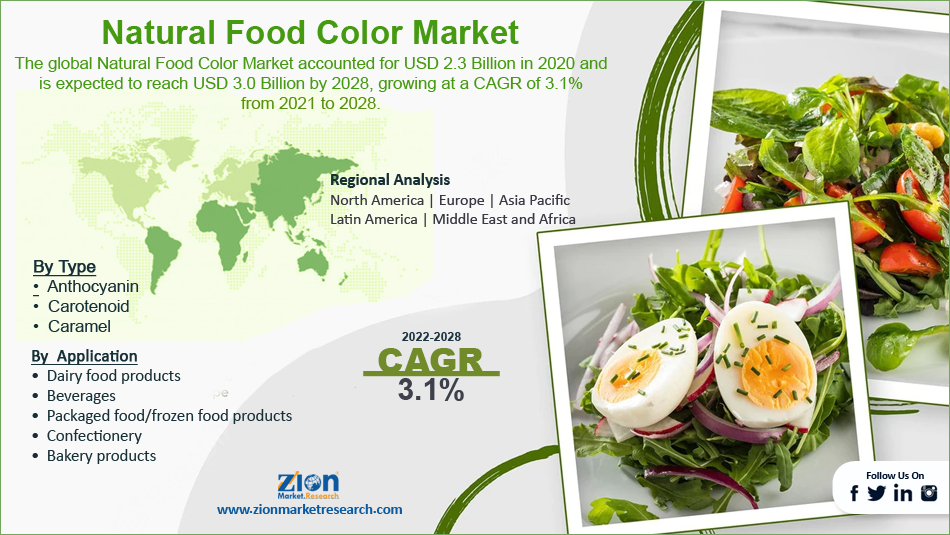
The global natural food color market size was worth around USD 3.99 Billion in 2024 and is predicted to grow to around USD 5.30 Billion by 2034 with a compound annual growth rate (CAGR) of roughly 2.9% between 2025 and 2034. The report analyzes the global natural food color market's drivers, restraints/challenges, and the effect they have on the demands during the projection period. In addition, the report explores emerging opportunities in the natural food color industry.
The rise in demand for natural food colors within the global market is owing to rising awareness associated with the damaging effects of synthetic color employment and the chemicals utilized in making them. Prohibition in the trading of synthetic color-made goods and its predication in selected global markets like all European nations and Japan elevated the need for a natural coloring market within the last decade. This trend is probably going to hold on for years to return boosting the natural coloring market.
Nevertheless, encouragement for employing natural food colors rather than synthetic food colors in novel items like infant toys and crayons, handmade paper, and organic textile printing is probably going to unlock growth opportunities for the natural coloring market in the years to return. Additionally, to present, the high-cost making of natural coloring is one of the main limiting factors for the event of the natural coloring market.
To know more about this report, request a sample copy.
Natural Food Color Market: Growth Factors
The industry is predicted to exhibit substantial growth on account of rising demand for the products by the alcoholic and non-alcoholic beverages manufacturing industries. Additionally, increasing demand for food colors obtained from non-synthetic sources including rising consumer awareness in the Asia Pacific and North America is predicted to bolster the demand over the forecast period. In addition, stringent regulations concerning the utilization of synthetic and identical colors are likely to emerge because of the major driver of industry growth.
Key Insights
- As per the analysis shared by our research analyst, the global natural food color market is estimated to grow annually at a CAGR of around 2.9% over the forecast period (2025-2034).
- Regarding revenue, the global natural food color market size was valued at around USD 3.99 Billion in 2024 and is projected to reach USD 5.30 Billion by 2034.
- The natural food color market is projected to grow at a significant rate due to rising consumer demand for clean-label products, health concerns over synthetic dyes, and growing application in beverages, bakery, and confectionery.
- Based on Ingredient, the Beta-carotene segment is expected to lead the global market.
- On the basis of Application, the Bakery & Confectionery segment is growing at a high rate and will continue to dominate the global market.
- Based on region, North America is predicted to dominate the global market during the forecast period.
Natural Food Color Market: Segmentation Analysis
The global natural food color market is segmented based on Ingredient, Application, and region.
Based on Ingredient, the global natural food color market is divided into Beta-carotene, Lycopene, Curcumin, Anthocyanin, Carmine, Copper Chlorophyllin, Paprika, Betanin, Riboflavin, Blue Spirulina, Caramel, Annatto, Others.
On the basis of Application, the global natural food color market is bifurcated into Bakery & Confectionery, Beverages, Dairy & Frozen Products, Meat Products, Oils & Fats, Fruits & Vegetables, Meat Alternatives/ Plant-based Meat, Pet Food.
Natural Food Color Market: Report Scope
| Report Attributes | Report Details |
|---|---|
| Report Name | Natural Food Color Market |
| Market Size in 2024 | USD 3.99 Billion |
| Market Forecast in 2034 | USD 5.30 Billion |
| Growth Rate | CAGR of 2.9% |
| Number of Pages | 213 |
| Key Companies Covered | NATUREX, Givaudan, BASF SE, Sensient Technologies Corporation, ADM, Spring TopCo DK ApS (Oterra), Allied Biotech Corporation, ROHA Group, Kalsec Inc., Döhler GmbH, San-Ei Gen F.F.I., Inc., AROMATAGROUP SRL, Ingredion, Vivify, Roquette Frères, INCOLTEC, IFC Solutions, Australian Food Ingredient Suppliers, and others. |
| Segments Covered | By Ingredient, By Application, and By Region |
| Regions Covered | North America, Europe, Asia Pacific (APAC), Latin America, The Middle East and Africa (MEA) |
| Base Year | 2024 |
| Historical Year | 2020 to 2023 |
| Forecast Year | 2025 - 2034 |
| Customization Scope | Avail customized purchase options to meet your exact research needs. Request For Customization |
Segment Analysis Preview
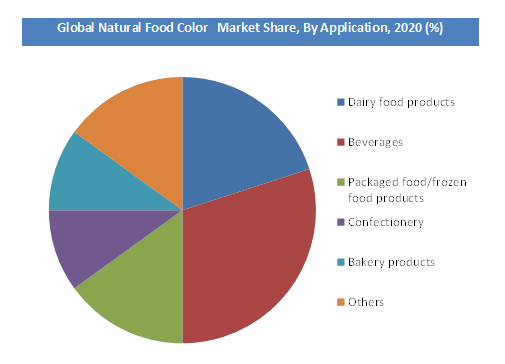
The Natural Food Color Market is segmented based on types and applications where the type segments include anthocyanin, carotenoid, and caramel. Key application segments covered under this study include dairy food products, beverages, packaged food/frozen food products, confectionery, and bakery products. Carotenoids accounted for over 32% of the market revenue on account of superior usage properties such as protection against chronic diseases, anti-oxidation, and cellular damage. In addition, the growing demand for carotenoids in frozen products, non-alcoholic beverages, and bakeries is expected to aid market growth globally. Various activities carried out by market players are also expected to boost the development of the natural food color market. For example, in November 2017, Chr. Hansen expanded its series of coloring foodstuff, assisting the food & beverage makers and boosting the natural food color market.
To know more about this report, Request For Customization.
Regional Analysis Preview
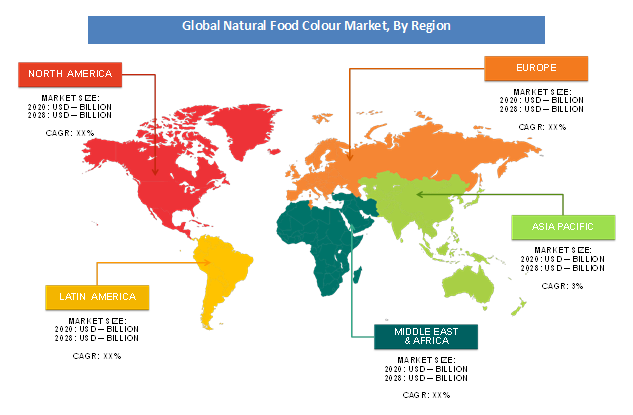
Regionally, North America ruled the regional natural coloring market in 2018 due to the most important number of health-related user bases within the area paired with the need for clean & healthy label food items. The Asia Pacific is probably going to be the quickest developing division for the natural coloring market within the years to return thanks to the rising demand for natural colors for ready-to-eat food items in China and India. the center East and Latin America are likely to develop rapidly within the natural coloring market shortly.
Natural Food Color Market: Competitive Analysis
The report provides a company market share analysis to give a broader overview of the key market players. In addition, the report also covers key strategic developments of the market, including acquisitions & mergers, new product launches, agreements, partnerships, collaborations & joint ventures, research & development, and regional expansion of major participants involved in the natural food color market on a global and regional basis.
The global natural food color market is dominated by players like:
- NATUREX
- Givaudan
- BASF SE
- Sensient Technologies Corporation
- ADM
- Spring TopCo DK ApS (Oterra)
- Allied Biotech Corporation
- ROHA Group
- Kalsec Inc.
- Döhler GmbH
- San-Ei Gen F.F.I. Inc.
- AROMATAGROUP SRL
- Ingredion
- Vivify
- Roquette Frères
- INCOLTEC
- IFC Solutions
- Australian Food Ingredient Suppliers
The global natural food color market is segmented as follows;
By Ingredient
- Beta-carotene
- Lycopene
- Curcumin
- Anthocyanin
- Carmine
- Copper Chlorophyllin
- Paprika
- Betanin
- Riboflavin
- Blue Spirulina
- Caramel
- Annatto
- Others
By Application
- Bakery & Confectionery
- Beverages
- Dairy & Frozen Products
- Meat Products
- Oils & Fats
- Fruits & Vegetables
- Meat Alternatives/ Plant-based Meat
- Pet Food
By Region
- North America
- The U.S.
- Canada
- Mexico
- Europe
- France
- The UK
- Spain
- Germany
- Italy
- Rest of Europe
- Asia Pacific
- China
- Japan
- India
- Australia
- South Korea
- Rest of Asia Pacific
- The Middle East & Africa
- Saudi Arabia
- UAE
- Egypt
- Kuwait
- South Africa
- Rest of the Middle East & Africa
- Latin America
- Brazil
- Argentina
- Rest of Latin America
Table Of Content
Methodology
HappyClients

