Global Lighting as a Service Market Size, Share, Trends, Growth 2032

Lighting as a Service Market By Components (Luminaries & Control equipment, Software & Communication systems and Maintenance & other services), By Installation (Indoor and Outdoor) and By End Use Industry (Commercial, Municipal and Industrial): Global Industry Perspective, Comprehensive Analysis and Forecast, 2024 - 2032
| Market Size in 2023 | Market Forecast in 2032 | CAGR (in %) | Base Year |
|---|---|---|---|
| USD 824.2 Million | USD 28170.54 Million | 42.4% | 2023 |
Global Lighting as a Service Market Insights
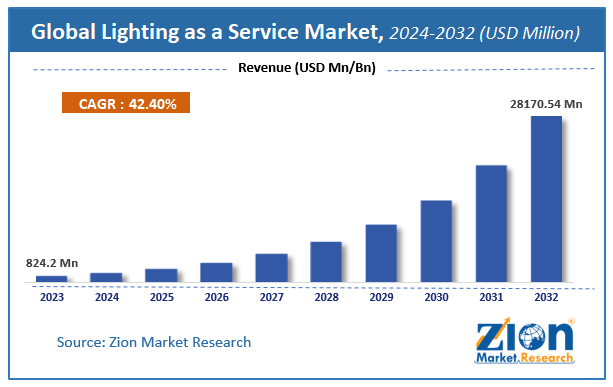
According to a report from Zion Market Research, the global Global Lighting as a Service Market was valued at USD 824.2 Million in 2023 and is projected to hit USD 28170.54 Million by 2032, with a compound annual growth rate (CAGR) of 42.4% during the forecast period 2024-2032. This report explores market strengths, weakness, opportunities, and threats. It also provides valuable insights into the market's growth drivers, challenges, and the future prospects that may emerge in the Global Lighting as a Service Market industry over the next decade.
Lighting as a Service Market: Overview
Global lightning as a Service is also known as Light as a Service, it is a service-based model which is expanding its market along with technological advancement across the world. The LED lighting is taking place of traditional incumbent technologies. Adoption of modern solutions in lightning system to meet customer demand is rapidly changing the industry.
The lightning service markets provide services like maintenance and management, installation, financials, technical, designing and other services. Companies even offer a combination of such services for providing better service, which enables better customer retention for longer period of time.
COVID-19 Impact Analysis
The Covid-19 pandemic has opened up gateways for technological vendors across the smart building sector for launching new propositions to help firms improve buildings infection control. The smart ultraviolet light solutions have been developed which can kill bacteria and viruses on surface through safe lighting rays. Measure in order to develop infection resistant systems have been serving as an opportunity in technological advances when it comes to market growth.
However, Covid-19 has been continuously affecting allied sectors that are associated with the lighting as service market. There has been a halt to the new commercial building projects. Additionally, the implementation of work-from-home policies is expected to hamper the market growth.
Lighting as a Service Market: Growth Factors
Rise in demand for energy has been driving the market as lightning as a service offers an efficient lighting system. Lighting as a service provide cost and energy saving properties, which is fueling its application in the sector. The lighting industry is facing an unprecedented disruption due to the shift of lighting from conventional mode to energy-efficient lighting. With this change in the industry, LED lighting is becoming more popular for business uses. The unreliability brought about by the conventional lighting is increasing the adoption of Lighting as a Service products. The key factor that lifts the market growth of lighting as a service market is the convenience provided by the lighting as a Service.
Lighting nearly accounts for 90% of electricity usage for households and 18-40% for economic premises. There's a growing demand for energy saving across the world, making scope for the market and emerging as a more convenient and efficient form of lighting. It is expected that the transition to energy-efficient lighting would scale back the world electricity demand for lighting by 30-40% in 2030.
Installation Segment Analysis Preview
Indoor segment held the largest market share of around 56.45% in 2020 and is expected to dominate the market during the forecast period. This is attributable to growing commercial sector in developing countries. With the increasing electricity consumption, various commercial industries are focusing on adoption of lighting as a service model, it mainly focuses on paying for the light and not the equipment that delivers it.
Although, the outdoor segment is estimated to constitute for the fastest growing segment in the market.
End User Segment Analysis Preview
Commercial end-users’ segment will grow at a CAGR of over 10% from 2021 to 2028. This is attributable to the energy savings and cost reductions offered by Lighting as a Service constitute a more feasible offer to the growing focus on sustainability and energy efficiency. The commercial segment includes the area used for commercial activities like offices, stores, institutions, malls, hospitals etc., these spaces are generally not for residential, industrial or manufacturing purposes.
Global Lighting as a Service Market: Report Scope
| Report Attributes | Report Details |
|---|---|
| Report Name | Global Lighting as a Service Market |
| Market Size in 2023 | USD 824.2 Million |
| Market Forecast in 2032 | USD 28170.54 Million |
| Growth Rate | CAGR of 42.4% |
| Number of Pages | 150 |
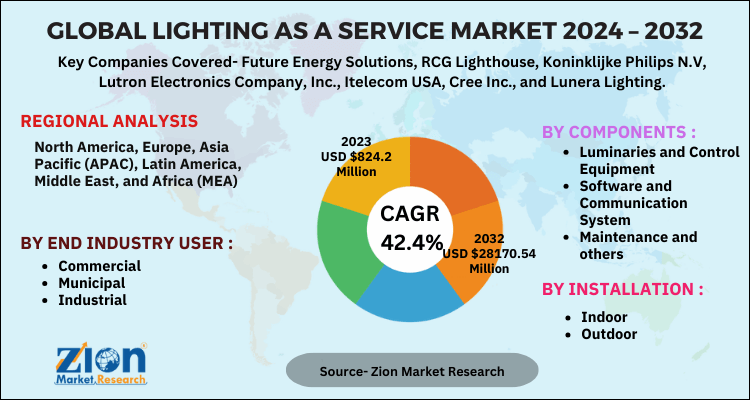
| Key Companies Covered | Future Energy Solutions, RCG Lighthouse, Koninklijke Philips N.V, Lutron Electronics Company, Inc., Itelecom USA, Cree Inc., and Lunera Lighting |
| Segments Covered | By Components, By Installation, By End Industry User and By Region |
| Regions Covered | North America, Europe, Asia Pacific (APAC), Latin America, Middle East, and Africa (MEA) |
| Base Year | 2023 |
| Historical Year | 2018 to 2022 |
| Forecast Year | 2024 - 2032 |
| Customization Scope | Avail customized purchase options to meet your exact research needs. Request For Customization |
Lighting as a Service Market: Regional Analysis Preview
The North American region is estimated to dominate the worldwide Lighting as a Service market within the forecast period, due to the government policies & regulations regarding the adoption of efficient lighting systems across the region. The United States is one of the major countries with significant development in electricity consumption, and is adopting various plans to increase the efficiency of the lighting system in the country. There is a huge presence of key players in this region that complements the growth with strong capability of R&D and technology.
The Asia Pacific region is projected to grow at a CAGR of more than 10% over the forecast period. The Asia-Pacific region is one of the fastest growing regions for lighting as a service market. The municipal end-users including lighting offered by local governments for open spaces public parking areas, walkways, streets, and highways are the market drivers in emerging countries. The countries in this region excluding Japan are the reason for fastest growth in the world.
Key Market Players & Competitive Landscape
Key players are focusing on enhancing their product line to meet the efficiency, ease of use and technological advancement requirement of the customers. Various Government authorities are taking initiatives on developing smart cities and upgrade the lighting system with smart lights, which is catering to the market growth of lighting as a service.
Some of key players in Global Lighting as a Service Market are
- Future Energy Solutions
- RCG Lighthouse
- Koninklijke Philips N.V
- Lutron Electronics Company Inc.
- Itelecom USA
- Cree Inc.
- Lunera Lighting.
The Global Lighting as a Service Market is segmented as follows:
By Components
- Luminaries and Control Equipment
- Software and Communication System
- Maintenance and others
By Installation
- Indoor
- Outdoor
By End Industry User
- Commercial
- Municipal
- Industrial
By Region
- North America
- The U.S.
- Canada
- Europe
- France
- The UK
- Spain
- Germany
- Italy
- Rest of Europe
- Asia Pacific
- China
- Japan
- India
- South Korea
- Southeast Asia
- Rest of Asia Pacific
- Latin America
- Brazil
- Mexico
- Rest of Latin America
- Middle East & Africa
- GCC
- South Africa
- Rest of Middle East & Africa
Table Of Content
Methodology
FrequentlyAsked Questions
According to a report from Zion Market Research, the global Global Lighting as a Service Market was valued at USD 824.2 Million in 2023 and is projected to hit USD 28170.54 Million by 2032.
According to a report from Zion Market Research, the global Global Lighting as a Service Market a compound annual growth rate (CAGR) of 42.4% during the forecast period 2024-2032.
Some of the key factors driving the Global Lighting as a Service Market growth are Rise in demand for energy has been driving the market as lightning as a service offers an efficient lighting system. Other benefits offered by lightning as service include ensuring cost savings, no safeguarding charge, which is enabling countries to use and convert their conventional system to lighting as a service model. Overall reductions in cost are accelerating the widespread adoption across the globe.
The North American region held a share of 35.65% in 2020. The North American region is estimated to dominate the worldwide Lighting as a Service market within the forecast period, due to the government policies & regulations regarding the adoption of providing efficient lighting systems across the region.
Some of key players in Global Lighting as a Service Market are Future Energy Solutions, RCG Lighthouse, Koninklijke Philips N.V, Lutron Electronics Company, Inc., Itelecom USA, Cree Inc., and Lunera Lighting.
HappyClients

