Heparin Market Size, Share, And Growth Report 2032

Heparin Market By Product Type (Unfractionated Heparin, Low Molecular Weight Heparin And Ultra-Low Molecular Weight Heparin), By Source (Bovine And Porcine), By Formulation Type (Oral, Parental), And By Region - Global And Regional Industry Overview, Market Intelligence, Comprehensive Analysis, Historical Data, And Forecasts 2024-2032
| Market Size in 2023 | Market Forecast in 2032 | CAGR (in %) | Base Year |
|---|---|---|---|
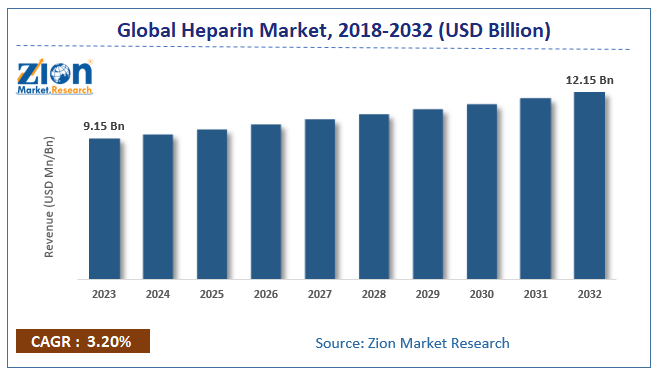
| USD 9.15 Billion | USD 12.15 Billion | 3.20% | 2023 |
The global heparin market size was worth around USD 9.15 billion in 2023 and is predicted to grow to around USD 12.15 billion by 2032 with a compound annual growth rate (CAGR) of roughly 3.20% between 2024 and 2032.
The report covers forecast and analysis for the heparin market on a global and regional level. The study provides historic data 2018 to 2022 along with a forecast from 2024 to 2032 based revenue (USD Billion).
 Request Free Sample
Heparin Market: Overview
Heparin is an injectable anticoagulant, which is a compound used to prevent blood clotting. Heparin is widely used clinically in practices like dialysis (370,000 patients/year), deep vein thrombosis (DVT) treatment, flushing IVs and central lines, and most cardiac surgeries. Cardiac surgery represents one of the largest groups with over half a million surgeries being performed annually. While heparin is a valuable drug, improper use can cause severe hemorrhaging (bleeding out). When this happens, the options are to wait for the heparin to wear-off or administer an antidote. After warfarin, heparin is mostly recommended for the treatment of coagulation disorders and during surgical procedures.
The heparin market is growing steadily due to increasing incidences of coagulation disorders, substantial growth in the number of the people suffering from diseases like venous thromboembolism and heart diseases. The FDA receives approximately 450,000 reports of adverse drug events per year. In a study analyzing 250,000 events occurring in 2005, 3.8% were related to heparin, and harm was caused in 275 cases. Between 2007 and 2008, heparin use caused 246 deaths, 149 of which were from an allergic reaction. In 36% of cases, the error is due to the wrong dose or quantity, where 18% of the time the error is due to an overdose of 100x or more. In addition, the considerable rise in the prevalence of the obesity is also expected to support the global growth of this market.
The study includes drivers and restraints for the heparin market along with the impact they have on the demand over the forecast period. Additionally, the report includes the study of opportunities available in the heparin market on a global level.
n order to give the users of this report a comprehensive view on the heparin market, we have included competitive landscape and analysis of Porter’s Five Forces model for the market. The study encompasses a market attractiveness analysis, wherein product type segment, type of form segment and type of formulation segments are benchmarked based on their market size, growth rate, and general attractiveness.
The report provides company market share analysis in order to give a broader overview of the key players in the market. In addition, the report also covers key strategic developments of the market including acquisitions & mergers, new technology launch, agreements, partnerships, collaborations & joint ventures, research & development, technology and regional expansion of major participants involved in the market on the global and regional basis. Moreover, the study covers price trend analysis, the product portfolio of various companies according to the region.
Heparin Market: Segmentation
The study provides a decisive view on the heparin market by segmenting the market based on product type, source type, type of formulation and regions. All the segments have been analyzed based on present and future trends and the market is estimated from 2024 to 2032.
Based on product type, the market is segmented into unfractionated heparin, low molecular weight heparin, and ultra-low molecular weight heparin.
On the basis of source type, the market is segmented into bovine and porcine.
Based on the type of formulation the market is segmented into oral and parental.
Heparin Market: Report Scope
| Report Attributes | Report Details |
|---|---|
| Report Name | Heparin Market Research Report |
| Market Size in 2023 | USD 9.15 Billion |
| Market Forecast in 2032 | USD 12.15 Billion |
| Growth Rate | CAGR of 3.20% |
| Number of Pages | 110 |
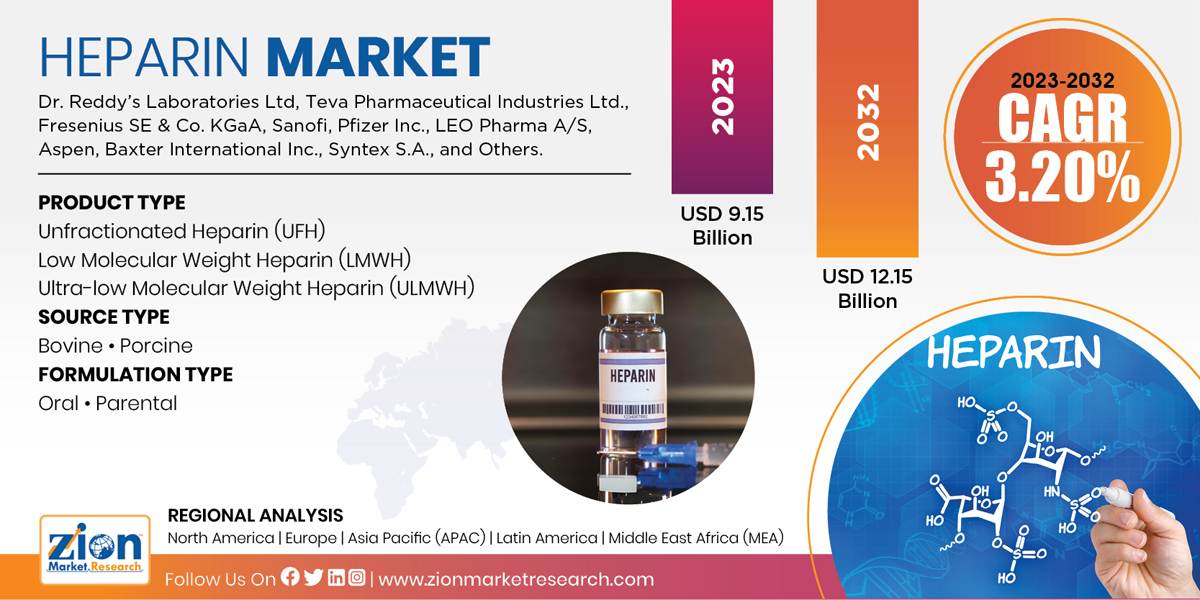
| Key Companies Covered | Dr. Reddy’s Laboratories Ltd, Teva Pharmaceutical Industries Ltd., Fresenius SE & Co. KGaA, Sanofi, Pfizer Inc., LEO Pharma A/S, Aspen, Baxter International Inc., Syntex S.A., and Others. |
| Segments Covered | By Product Type, By Source, By Formulation, And By Region |
| Regions Covered | North America, Europe, Asia Pacific (APAC), Latin America, Middle East, and Africa (MEA) |
| Base Year | 2023 |
| Historical Year | 2018 to 2022 |
| Forecast Year | 2024 - 2032 |
| Customization Scope | Avail customized purchase options to meet your exact research needs. Request For Customization |
Heparin Market: Regional Analysis
The regional segmentation includes the current and forecast demand for North America, Europe, Asia Pacific, Latin America and Middle East & Africa with its further bifurcation into major countries including the U.S., Canada, Rest of North America, U.K., Germany, France, Italy, Spain, Russia, Rest of Europe, China, Japan, India, Australia, Rest of Asia Pacific, Brazil, Mexico, Argentina, Rest of Latin America, Saudi Arabia, UAE, Qatar, South Africa and Rest of Middle East and Africa. This segmentation includes demand for heparin market based on individual product type, source, and type of formulation in all the regions and countries.
North America held a dominant share of the global heparin market which is attributed due to the sophisticated healthcare infrastructure; increasing number of medical tourists and a large number of surgical procedures conducted in the country. Asia-Pacific is projected to grow at a significant CAGR. The probability of pulmonary embolism in India, according to the National Institute of Health Consensus, is close to a 20.0%, whereas the overall incidence of DVT after elective hip surgery is approximately a 45.0% to 70.0%.
Heparin Market: Competitive Analysis
The report also includes detailed profiles of end players such as:
- Dr. Reddy’s Laboratories Ltd
- Teva Pharmaceutical Industries Ltd.
- Fresenius SE & Co. KGaA
- Sanofi
- Pfizer Inc.
- LEO Pharma A/S
- Aspen
- Baxter International Inc.
- Syntex S.A.
- Others.
The global heparin market is segmented as follows:
Global Heparin Market: Product Type Segment Analysis
- Unfractionated Heparin (UFH)
- Low Molecular Weight Heparin (LMWH)
- Ultra-low Molecular Weight Heparin (ULMWH)
Global Heparin Market: Source Type Segment Analysis
- Bovine
- Porcine
Global Heparin Market: Formulation Type Segment Analysis
- Oral
- Parental
Global Heparin Market: Regional Segment Analysis
- North America
- The U.S.
- Europe
- The UK
- France
- Germany
- The Asia Pacific
- China
- Japan
- India
- Latin America
- Brazil
- The Middle East and Africa
What Reports Provides
- Full in-depth analysis of the parent market
- Important changes in market dynamics
- Segmentation details of the market
- Former, on-going, and projected market analysis in terms of volume and value
- Assessment of niche industry developments
- Market share analysis
- Key strategies of major players
- Emerging segments and regional markets
- Testimonials to companies in order to fortify their foothold in the market.
Table Of Content
Methodology
FrequentlyAsked Questions
Heparin is an injectable anticoagulant, which is a compound used to prevent blood clotting.
According to study, the global Heparin market size was worth around USD 9.15 billion in 2023 and is predicted to grow to around USD 12.15 billion by 2032.
The CAGR value of Heparin market is expected to be around 3.20% during 2024-2032.
North America has been leading the global Heparin market and is anticipated to continue on the dominant position in the years to come.
The global Heparin market is led by players like Dr. Reddy’s Laboratories Ltd, Teva Pharmaceutical Industries Ltd., Fresenius SE & Co. KGaA, Sanofi, Pfizer Inc., LEO Pharma A/S, Aspen, Baxter International Inc., Syntex S.A., and Others.
HappyClients

