FPSO Market Size, Share, Trends, Growth and Forecast 2032

FPSO Market - by Type (Converted FPSO Systems, New-Build FPSO Systems, Redeployed FPSO Systems), Water Depth (Shallow Water, Deepwater, Ultra-Deepwater Systems), Equipment (Nitrogen Generation, Seawater Injection, Fuel Gas Treatment, Produced Water, Crude Oil Separation, Chemical Injection): Global Industry Perspective, Comprehensive Analysis and Forecast, 2024 - 2032
| Market Size in 2023 | Market Forecast in 2032 | CAGR (in %) | Base Year |
|---|---|---|---|
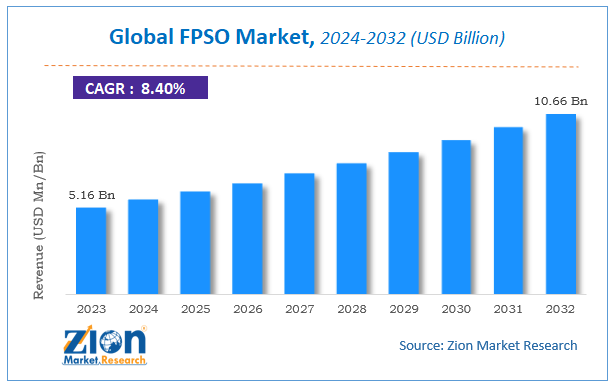
| USD 5.16 Billion | USD 10.66 Billion | 8.4% | 2023 |
FPSO Market Insights
Zion Market Research has published a report on the global FPSO Market, estimating its value at USD 5.16 Billion in 2023, with projections indicating that it will reach USD 10.66 Billion by 2032. The market is expected to expand at a compound annual growth rate (CAGR) of 8.4% over the forecast period 2024-2032.
The report explores the factors fueling market growth, the hitches that could hamper this expansion, and the opportunities that may arise in the FPSO industry. Additionally, it offers a detailed analysis of how these elements will affect market demand dynamics and market performance throughout the forecast period.
Global FPSO Market: Overview
FPSO stands for Floating Production, Storage, and Offloading. An FPSO vessel is a type of floating production system that is used for the offshore production, storage, and offloading of oil and gas. Usually, it is a vessel that is a converted oil tanker or a newly constructed FPSO unit. An FPSO often resembles a ship, equipped with production and processing facilities onboard. FPSOs comprise offloading facilities for the transportation of processed oil and gas to onshore receiving facilities through a shuttle tanker. These vessels are used to extract or receive raw hydrocarbons from sea beds, which are then processed in onboard processing facilities.
Global FPSO Market: Growth Factors
The installation of fixed processing and production facilities is technically very complex and costly in remote oil and gas production areas; this, in turn, increases the demand for FPSOs excluding the need for fixed processing facilities. Marginal fields and challenging environments have been others factors that act as driving factors of FPSO market expansion. The considerable expansion in oil & gas exploration and production in deep water, ultra-deep water, and offshore fields is expected to boost the global FPSO market growth over the forecast period. Increasing consumption of oil & gas globally, particularly in power generation and transportation sectors has made companies explore more hydrocarbon reserves.
Global FPSO Market: Segmentation
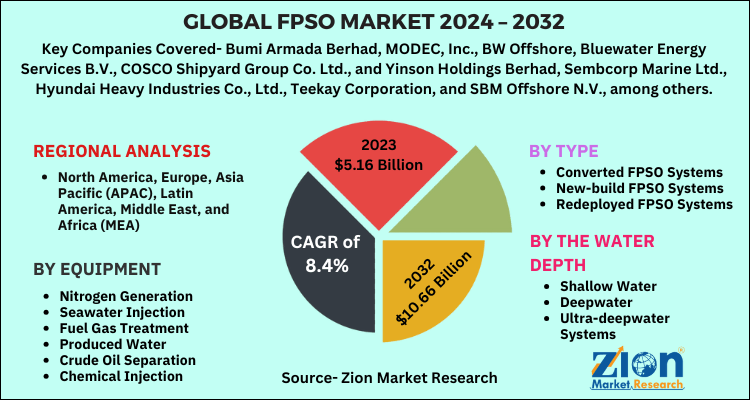
On the basis of type, the global FPSO market is segmented as converted FPSO systems, new-build FPSO systems, and redeployed FPSO systems. Presently, the market is dominated by the converted FPSO systems segment. On the other hand, the demand for new-build FPSO systems has decreased owing to the reduced costs of oils in oil and gas exploration industries. Based on the water depth, the market has been segmented into shallow water, deepwater, and ultra-deepwater systems. On the basis of equipment, the FPSO market is segmented as nitrogen generation, seawater injection, fuel gas treatment, produced water, crude oil separation, and chemical injection.
FPSO Market: Report Scope
| Report Attributes | Report Details |
|---|---|
| Report Name | FPSO Market |
| Market Size in 2023 | USD 5.16 Billion |
| Market Forecast in 2032 | USD 10.66 Billion |
| Growth Rate | CAGR of 8.4% |
| Number of Pages | 110 |
| Key Companies Covered | Bumi Armada Berhad, MODEC, Inc., BW Offshore, Bluewater Energy Services B.V., COSCO Shipyard Group Co. Ltd., and Yinson Holdings Berhad, Sembcorp Marine Ltd., Hyundai Heavy Industries Co., Ltd., Teekay Corporation, and SBM Offshore N.V., among others |
| Segments Covered | By Type, By Application, By Process And By Region |
| Regions Covered | North America, Europe, Asia Pacific (APAC), Latin America, Middle East, and Africa (MEA) |
| Base Year | 2023 |
| Historical Year | 2018 to 2022 |
| Forecast Year | 2024 - 2032 |
| Customization Scope | Avail customized purchase options to meet your exact research needs. Request For Customization |
Global FPSO Market: Regional Analysis
North America and Europe are the dominant players of the global FPSO market and are anticipated to witness considerable growth in coming years owing to mature oil & gas reserves. In addition, South America and East Africa are also expected to experience significant growth due to recent offshore E&P developments and deep water oil field discoveries. Further, Brazil is expected to emerge as a major FPSO market in this region due to rising oil & gas activities along with considerable government support. Recent deep sea oil & gas reserves in South China Sea, North Sea, and Gulf of Mexico are expected to positively impact the global market growth in the near future.
Global FPSO Market: Competitive Players
- Bumi Armada Berhad
- MODEC
- BW Offshore
- Bluewater Energy Services B.V.
- COSCO Shipyard Group Co. Ltd.
- Yinson Holdings Berhad. Sembcorp Marine Ltd.
- Hyundai Heavy Industries Co.
- Teekay Corporation
- SBM Offshore N.V.
Global FPSO Market: Regional Segment Analysis
- North America
- The U.S.
- Canada
- Europe
- France
- The UK
- Spain
- Germany
- Italy
- Rest of Europe
- Asia Pacific
- China
- Japan
- India
- South Korea
- Southeast Asia
- Rest of Asia Pacific
- Latin America
- Brazil
- Mexico
- Rest of Latin America
- Middle East & Africa
- GCC
- South Africa
- Rest of Middle East & Africa
Table Of Content
Methodology
FrequentlyAsked Questions
HappyClients

