Eco-Friendly Labels Market Size, Share, Trends and Outlook 2032

Eco-Friendly Labels Market By Label Type (Pressure Sensitive Labels, Wet Glue Labels, Shrink Labels, and Stretch labels), By Material (Paper and Plastic), By Printing Technology (Flexography, Digital, Offset, Gravure, and Screen), By End-Use (Food & Beverages, Automotive, Pharmaceutical, Cosmetics & Personal Care, Home Care & Toiletries, Clothing & Apparels, and Chemicals), And By Region- Global Industry Perspective, Comprehensive Analysis, and Forecast, 2024-2032
| Market Size in 2023 | Market Forecast in 2032 | CAGR (in %) | Base Year |
|---|---|---|---|
| USD 1505.81 Million | USD 2501.16 Million | 5.8% | 2023 |
Eco-Friendly Labels Market Insights
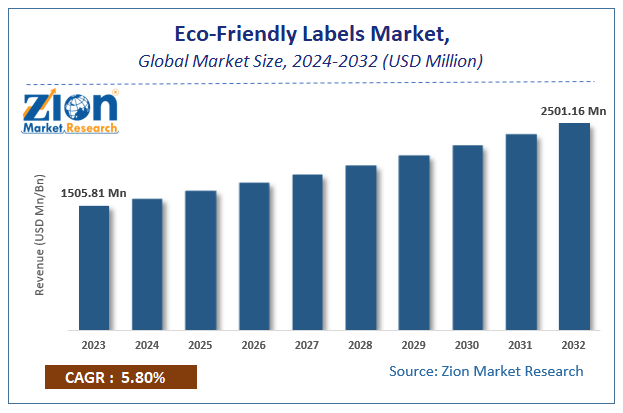
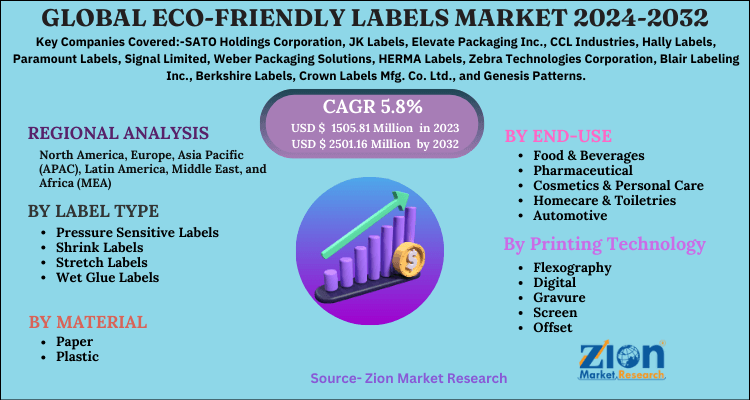
According to Zion Market Research, the global Eco-Friendly Labels Market was worth USD 1505.81 Million in 2023. The market is forecast to reach USD 2501.16 Million by 2032, growing at a compound annual growth rate (CAGR) of 5.8% during the forecast period 2024-2032. The report offers a comprehensive analysis of the market, highlighting the factors that will determine growth, potential challenges, and opportunities that could emerge in the Eco-Friendly Labels Market industry over the next decade.
Eco-friendly Labels Market: Overview
Eco-friendly labels are produced by making use of environmentally friendly materials and are designed for reducing the carbon footprints of firms. Sustainable material choices for producing eco-friendly labels include renewable and recycled materials. Apart from this, labels are used in every sphere of day-to-day activity for displaying warnings, directions, the importance of tree plantation, the benefit of cleanliness, COVID -19 awareness, vaccine Information, and green environment advocacy along with other promotional events. With the need for an increased shelf life of labels, the eco-friendly labels market is slated to experience accelerated growth over the forecast period.
Eco-friendly Labels Market: Growth Factors
Massive demand for sustainable labels manufactured from dissolvable & reputable papers, renewable papers & fabrics, and customer scrap will steer the growth of the eco-friendly labels industry over 2023-2032. High awareness about environmental pollution and landfills among consumers has resulted in a growing preference for environment-friendly labels & packaging, thereby driving market trends. Favorable product features including biodegradation and recallability will steer the expansion of the eco-friendly labels market in upcoming years.
The rise in the sale of eco-friendly labels for packaging activities and large occupancy of shelf space by eco-friendly labels in supermarkets & hypermarkets will augment the size of the eco-friendly labels market. The rise in pressurization and the need to attract customers by bringing improvement in the aesthetic appearance of packaging products will promulgate growth of the eco-friendly labels industry during the forecast period.
Eco-Friendly Labels Market: Report Scope
| Report Attributes | Report Details |
|---|---|
| Report Name | Eco-Friendly Labels Market |
| Market Size in 2023 | USD 1505.81 Million |
| Market Forecast in 2032 | USD 2501.16 Million |
| Growth Rate | CAGR of 5.8% |
| Number of Pages | 130 |
| Key Companies Covered | SATO Holdings Corporation, JK Labels, Elevate Packaging Inc., CCL Industries, Hally Labels, Paramount Labels, Signal Limited, Weber Packaging Solutions, HERMA Labels, Zebra Technologies Corporation, Blair Labeling Inc., Berkshire Labels, Crown Labels Mfg. Co. Ltd., and Genesis Patterns. |
| Segments Covered | By Label Type, By Material, By End-Use, By Printing Technology, And By Region |
| Regions Covered | North America, Europe, Asia Pacific (APAC), Latin America, Middle East, and Africa (MEA) |
| Base Year | 2023 |
| Historical Year | 2018 to 2022 |
| Forecast Year | 2024 - 2032 |
| Customization Scope | Avail customized purchase options to meet your exact research needs. Request For Customization |
Eco-Friendly Labels Market: Regional Landscape
The Asia Pacific To Lead Regional Market Growth During 2024-2032
Expansion of eco-friendly labels industry in the Asia Pacific over forecast timeline is due to surge in populace & environmental consciousness among the persons. Apart from this, with countries such as India and China being major business destinations, the sale of eco-friendly products is predicted to increase manifold in these countries, thereby contributing sizably to market size in the Asia Pacific.
Additionally, governments of the Asia Pacific region are supporting the use of renewable & environment-friendly products. This, in turn, will open new prospects for growth for the eco-friendly labels market in the Asia Pacific over the forecast timeline.
Eco-Friendly Labels Market: Competitive Landscape
Some of the leading in the global market include
- SATO Holdings Corporation
- JK Labels
- Elevate Packaging Inc.
- CCL Industries
- Hally Labels
- Paramount Labels
- Signal Limited
- Weber Packaging Solutions
- HERMA Labels
- Zebra Technologies Corporation
- Blair Labeling Inc.
- Berkshire Labels
- Crown Labels Mfg. Co. Ltd.
- Genesis Patterns.
The global Eco-Friendly Labels Market is segmented as follows:
By Label Type
- Pressure Sensitive Labels
- Shrink Labels
- Stretch Labels
- Wet Glue Labels
By Material
- Paper
- Plastic
By End-Use
- Food & Beverages
- Pharmaceutical
- Cosmetics & Personal Care
- Homecare & Toiletries
- Automotive
- Clothing & Apparels
- Chemicals
By Printing Technology
- Flexography
- Digital
- Gravure
- Screen
- Offset
By Region
- North America
- The U.S.
- Canada
- Europe
- France
- The UK
- Spain
- Germany
- Italy
- Rest of Europe
- Asia Pacific
- China
- Japan
- India
- South Korea
- Southeast Asia
- Rest of Asia Pacific
- Latin America
- Brazil
- Mexico
- Rest of Latin America
- Middle East & Africa
- GCC
- South Africa
- Rest of the Middle East & Africa
Table Of Content
Methodology
FrequentlyAsked Questions
HappyClients

