Digital Therapeutic Devices Market Size, Share, Growth Report 2032

Digital Therapeutic Devices Market by Application (Preventive [Obesity, Smoking Cessation, and Pre-Diabetes] and Treatment [Diabetes, CNS Diseases, Cardiovascular Diseases, Respiratory Diseases, and Medication Adherence]) and Sales Channel (B2B [Employers, Wellness Centers, Fitness Centers, and Gyms] and B2C [Patients and Caregivers]) - Global Industry Perspective, Comprehensive Analysis and Forecast, 2024 - 2032
| Market Size in 2023 | Market Forecast in 2032 | CAGR (in %) | Base Year |
|---|---|---|---|
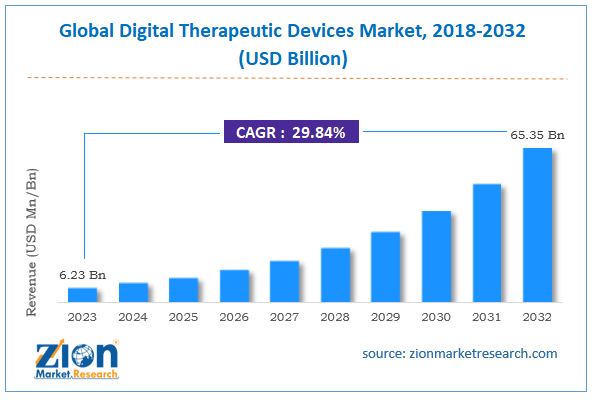
| USD 6.23 Billion | USD 65.35 Billion | 29.84% | 2023 |
Digital Therapeutic Devices Industry Perspective:
The global digital therapeutic devices market size was worth around USD 6.23 billion in 2023 and is predicted to grow to around USD 65.35 billion by 2032 with a compound annual growth rate (CAGR) of roughly 29.84% between 2024 and 2032.
 Request Free SampleRequest Free SampleRequest Free Sample
The report covers forecasts and analysis for the digital therapeutic devices market on a global and regional level. The study provides historical data from 2018 to 2022 along with a forecast from 2024 to 2032 based on revenue (USD Billion). The study includes drivers and restraints for the digital therapeutic devices market along with the impact they have on the demand over the forecast period. Additionally, the report includes the study of opportunities available in the digital therapeutic devices market on a global level.
In order to give the users of this report a comprehensive view of the digital therapeutic devices market, we have included a competitive landscape and analysis of Porter’s Five Forces model for the market. The study encompasses a market attractiveness analysis, wherein all segments are benchmarked based on their market size, growth rate, and general attractiveness.
The report provides a company market share analysis in order to give a broader overview of the key players in the market. In addition, the report also covers key strategic developments of the market including acquisitions & mergers, new product launches, agreements, partnerships, collaborations & joint ventures, research & development, and product and regional expansion of major participants involved in the market.
Digital therapeutics is a sub-section of digital health. It is a health treatment option which uses online and digital health technologies to treat medical and psychological conditions of an individual. The treatment given in digital therapeutics depends on the behavior and lifestyle changes of the individual. In this technology, data is collected and then analyzed as a progress report or a preventative measure for treatment.
The global digital therapeutic devices market is primarily driven by the rise in the use of technology such as smartphones and laptops for the treatment of different medical conditions. The rapid increase in disposable income in various developing countries increases the demand for the technologically advanced products for the treatment of medical conditions, which is driving the growth of the global digital therapeutic devices market. Increase in support of government for the use of digital therapeutic devices and rapid increase in awareness regarding the cost saving associated with digital therapeutic devices market is expected to fuel the growth of the digital therapeutic devices market.
According to the statistics published by CDC in 2012, about 50% of adults in the U.S. were suffering from chronic health conditions. Digital therapeutic devices allow the healthcare professionals to treat chronic diseases and efficiently manage them. This is also expected to drive the growth of the digital therapeutic devices market. However, safety about the patient’s information, the rise in data breaching, and lack of awareness related to therapeutic devices are factors expected to limit the growth of the digital therapeutic devices market.
 Request Free SampleRequest Free SampleRequest Free Sample
Digital Therapeutic Devices Market: Segment Analysis
The study provides a decisive view of the digital therapeutic devices market by segmenting it on the basis of application, sales channel, and region. All the segments have been analyzed based on present and future trends and the market is estimated from 2024 to 2032.
Based on the application, digital therapeutic devices market is further segmented into preventive and treatment. The preventive application segment is further divided into obesity, smoking cessation, and pre-diabetes. Furthermore, the treatment segment is sub-segmented into diabetes, central nervous system diseases, musculoskeletal diseases, cardiovascular diseases, respiratory disease, and medication adherence.
Based on sales channel, the digital therapeutic devices market is segmented into business-to-business and business-to-consumer. Business-to-business is further sub-segmented into employers, wellness centers, fitness centers, and gyms. The business-to-consumer segment consists of patients and caregivers.
Digital Therapeutic Devices Market: Report Scope
| Report Attributes | Report Details |
|---|---|
| Report Name | Digital Therapeutic Devices Market |
| Market Size in 2023 | USD 6.23 Billion |
| Market Forecast in 2032 | USD 65.35 Billion |
| Growth Rate | CAGR of 29.84% |
| Number of Pages | 220 |
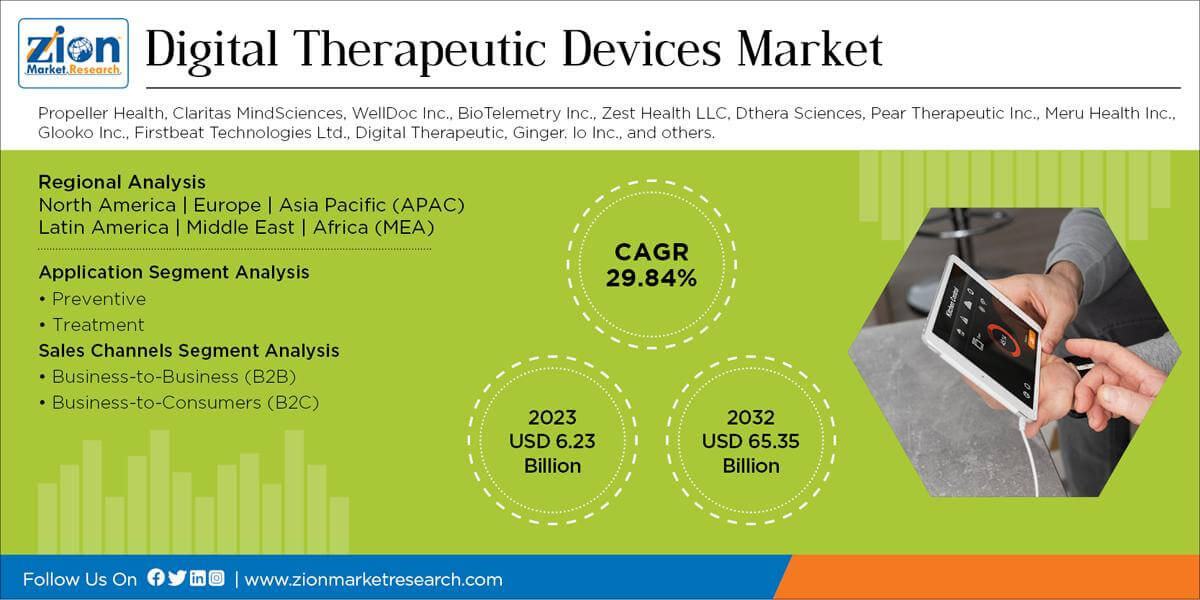
| Key Companies Covered | Propeller Health, Claritas MindSciences, WellDoc Inc., BioTelemetry Inc., Zest Health LLC, Dthera Sciences, Pear Therapeutic Inc., Meru Health Inc., Glooko Inc., Firstbeat Technologies Ltd., Digital Therapeutic, Ginger. Io Inc., and others. |
| Segments Covered | By Application, By Sales Channels, and By Region |
| Regions Covered | North America, Europe, Asia Pacific (APAC), Latin America, The Middle East and Africa (MEA) |
| Base Year | 2023 |
| Historical Year | 2018 to 2022 |
| Forecast Year | 2024 - 2032 |
| Customization Scope | Avail customized purchase options to meet your exact research needs. Request For Customization |
The regional segmentation includes the current and forecast demand for North America, Europe, Asia Pacific, Latin America, and the Middle East & Africa with its further categorization into major countries including the U.S., UK, Germany, France, China, Japan, India, Brazil, etc. This segmentation includes demand for digital therapeutic devices market based on all segments in all the regions and countries.
North America is expected to lead the market in the forecast period due to the early adoption of technology, increase in investment in healthcare technologies and awareness about patient’s wellness. The increase in chronic diseases and disorders related to the changing lifestyle and rapid technological advancements is expected to drive the growth of digital therapeutic devices market in the Asia Pacific. This region is expected to grow at a higher CAGR as compared to other regions.
Digital Therapeutic Devices Market: Competitive Analysis
The key players in the global digital therapeutic devices market are Propeller Health, Claritas MindSciences, WellDoc Inc., BioTelemetry Inc., Zest Health LLC, Dthera Sciences, Pear Therapeutic Inc., Meru Health Inc., Glooko Inc., Firstbeat Technologies Ltd., Digital Therapeutic, and Digital Twine Health Inc. The players are involved in merger and acquisitions to innovate new therapeutic devices which use new technologies for treatment.
The global digital therapeutic devices market is dominated by players like:
- Propeller Health
- Claritas MindSciences
- WellDoc Inc.
- BioTelemetry Inc.
- Zest Health LLC
- Dthera Sciences
- Pear Therapeutic Inc.
- Meru Health Inc.
- Glooko Inc.
- Firstbeat Technologies Ltd.
- Digital Therapeutic
- Ginger. Io Inc.
This report segments the global digital therapeutic devices market as follows:
Global Digital Therapeutic Devices Market: Application Segment Analysis
- Preventive
- Obesity
- Smoking Cessation
- Pre-diabetes
- Treatment
- Diabetes
- CNS Diseases
- Musculoskeletal Diseases
- Cardiovascular Diseases
- Respiratory Diseases
- Medication Adherence
Global Digital Therapeutic Devices Market: Sales Channels Segment Analysis
- Business-to-Business (B2B)
- Employers
- Wellness Centers
- Fitness Centers
- Gyms
- Business-to-Consumers (B2C)
- Patients
- Caregivers
Global Digital Therapeutic Devices Market: Regional Segment Analysis
- North America
- The U.S.
- Europe
- UK
- France
- Germany
- Asia Pacific
- China
- Japan
- India
- Latin America
- Brazil
- The Middle East and Africa
Table Of Content
Methodology
FrequentlyAsked Questions
Digital therapeutics is a health care intervention delivered through smart devices to support the behavior of an individual and also provide therapeutic effects accordingly.
According to a study, the global digital therapeutic devices market size was worth around USD 6.23 billion in 2023 and is expected to reach USD 65.35 billion by 2032.
The global digital therapeutic devices market is expected to grow at a CAGR of 29.84% during the forecast period.
North America is expected to dominate the digital therapeutic devices market over the forecast period.
Leading players in the global digital therapeutic devices market include Propeller Health, Claritas MindSciences, WellDoc Inc., BioTelemetry Inc., Zest Health LLC, Dthera Sciences, Pear Therapeutic Inc., Meru Health Inc., Glooko Inc., Firstbeat Technologies Ltd., Digital Therapeutic, and Ginger. Io Inc., among others.
The digital therapeutic devices market report covers the geographical market along with a comprehensive competitive landscape analysis. It also includes cash flow analysis, profit ratio analysis, market basket analysis, market attractiveness analysis, sentiment analysis, PESTLE analysis, trend analysis, SWOT analysis, trade area analysis, demand & supply analysis, Porter’s five forces analysis, and value chain analysis.
HappyClients

