Data Visualization Tools Market Growth, Size, Share, Trends, and Forecast 2032

Data Visualization Tools Market - By Component (Software and Services), By Industry (BFSI, Construction & Real Estate, Consumer Goods, Education, Government, Pharmaceuticals, IT, and Healthcare) And By Region- Global Industry Perspective, Comprehensive Analysis, and Forecast, 2024 - 2032-
| Market Size in 2023 | Market Forecast in 2032 | CAGR (in %) | Base Year |
|---|---|---|---|
| USD 8.75 Billion | USD 22.11 Billion | 9.7% | 2023 |
Data Visualization Tools Market Insights
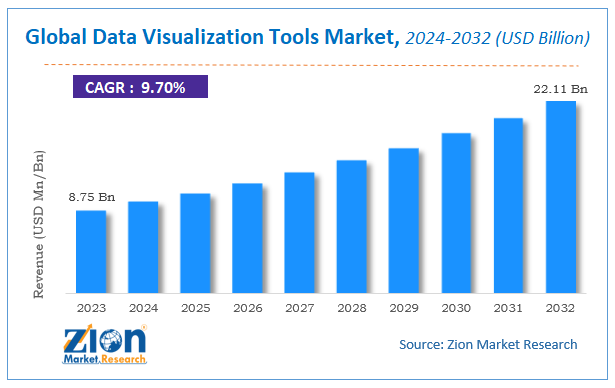
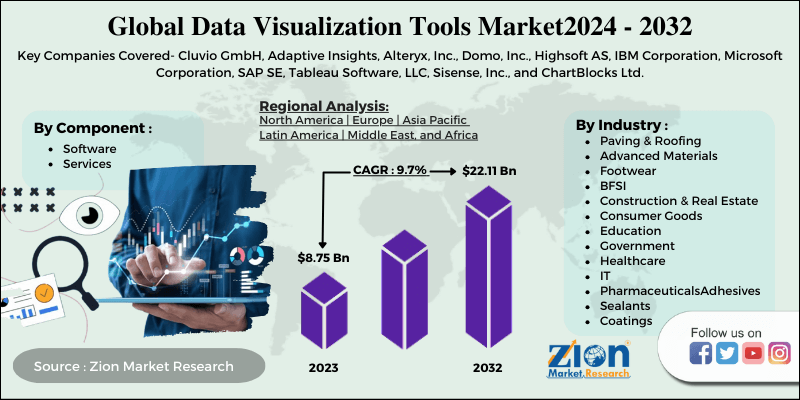
According to a report from Zion Market Research, the global Data Visualization Tools Market was valued at USD 8.75 Billion in 2023 and is projected to hit USD 22.11 Billion by 2032, with a compound annual growth rate (CAGR) of 9.7% during the forecast period 2024-2032. This report explores market strengths, weakness, opportunities, and threats. It also provides valuable insights into the market's growth drivers, challenges, and the future prospects that may emerge in the Data Visualization Tools Market industry over the next decade.
The report offers assessment and analysis of the Data Visualization Tools market on a global and regional level. The study offers a comprehensive assessment of the market competition, constraints, revenue estimates, opportunities, evolving trends, and industry-validated data. The report provides historical data from 2018 to 2022 along with a forecast from 2024 to 2032 based on revenue (USD Billion).
Data Visualization Tools Market: Overview?
Data visualization tools offer designers in producing visual representations of big data sets in an easier way. These tools help data scientists or data analysts in dealing with data sets comprising of large number of data points along with automating visualization process. In addition to this, tools of data visualization can be utilized for yearly reports, investor slide decks, dashboards, and sales & marketing activities. The best of these tools can handle multiple data sets in a single visualization and can display various kinds of charts, maps, and graphs in an effective way. Citing an instance, tableau software is the best example of the data visualization tool and public version of this software is available for free for producing data visualizations.
Data Visualization Tools Market: Growth Drivers
Surge in acceptance of data visualization tools by small, giant, and medium-scale firms will steer the growth of data visualization tools market over 2024 – 2032. In addition to this, massive use of these tools in predictive analytics as well as by software advisory services will embellish the size of data visualization tools industry over the assessment period. Apart from this, data visualization platform assists business personnel in gaining insights from large proportion of unstructured data and facilitates in effectively demonstrating data for unsupervised learning algorithm such as K-means algorithm. All these aspects will not only enhance the market profitability but will also help in expanding the market scope. Additionally, need for effective graphical data representation in the form of pie chart, scatter plots, column chart, and line chart will assist in increasing market size over the years ahead.
Furthermore, with increase in the data and need for critically examining purchasing pattern of the consumers has resulted in massive demand for data visualization tools by retail shops and supermarket & hypermarket stores in the recent years. This, in turn, will generate high growth prospects for data visualization tools market in the coming years.
Data Visualization Tools Market: Report Scope
| Report Attributes | Report Details |
|---|---|
| Report Name | Data Visualization Tools Market |
| Market Size in 2023 | USD 8.75 Billion |
| Market Forecast in 2032 | USD 22.11 Billion |
| Growth Rate | CAGR of 9.7% |
| Number of Pages | 130 |
| Key Companies Covered | Cluvio GmbH, Adaptive Insights, Alteryx, Inc., Domo, Inc., Highsoft AS, IBM Corporation, Microsoft Corporation, SAP SE, Tableau Software, LLC, Sisense, Inc., and ChartBlocks Ltd. |
| Segments Covered | By Industry, By Component, and By Region |
| Regions Covered | North America, Europe, Asia Pacific (APAC), Latin America, Middle East, and Africa (MEA) |
| Base Year | 2023 |
| Historical Year | 2018 to 2022 |
| Forecast Year | 2024 - 2032 |
| Customization Scope | Avail customized purchase options to meet your exact research needs. Request For Customization |
Data Visualization Tools Market: Regional Insights
North America To Make Notable Contributions Towards Overall Market Share By 2032
The expansion of data visualization tools industry in North America over the assessment timespan can be credited to massive use of data visualization tools in the small & medium-scale companies in the U.S. In addition to this, rise in the need for data analytics in flourishing retail sector across countries like Canada & the U.S. will result in expansion of market size in the region over 2024 – 2032. Humungous need for information tracking from different sources and then representing this information through various kinds of charts in the form of data representation will drive the regional market trends.
Data Visualization Tools Market: Competitive Space
Key players profiled in the study include:
- Cluvio GmbH
- Adaptive Insights
- Alteryx, Inc.
- Domo, Inc.
- Highsoft AS
- IBM Corporation
- Microsoft Corporation
- SAP SE
- Tableau Software
- LLC
- Sisense, Inc.
- ChartBlocks Ltd.
The global Data Visualization Tools Market is segmented as follows:
By Industry
- BFSI
- Construction & Real Estate
- Consumer Goods
- Education
- Government
- Healthcare
- IT
- Pharmaceuticals
By Component
- Software
- Services
By Region
- North America
- The U.S.
- Canada
- Europe
- France
- The UK
- Spain
- Germany
- Italy
- Rest of Europe
- Asia Pacific
- China
- Japan
- India
- South Korea
- Southeast Asia
- Rest of Asia Pacific
- Latin America
- Brazil
- Mexico
- Rest of Latin America
- Middle East & Africa
- GCC
- South Africa
- Rest of Middle East & Africa
Table Of Content
Methodology
FrequentlyAsked Questions
Surge in acceptance of data visualization tools by small, giant, and medium-scale firms will steer the growth of data visualization tools market over 2024 – 2032 In addition to this, massive use of these tools in predictive analytics as well as by software advisory services will embellish the size of data visualization tools industry over the assessment period. Apart from this, data visualization platform assists business personnel in gaining insights from large proportion of unstructured data and facilitates in effectively demonstrating data for unsupervised learning algorithm such as K-means algorithm.
According to Zion market research report, the global Data Visualization Tools Market was valued at USD 8.75 Billion in 2023 and is projected to hit USD 22.11 Billion by 2032, with a compound annual growth rate (CAGR) of 9.7% during the forecast period 2024-2032.
North America will contribute lucratively towards the global market size over the estimated timeline. The regional market surge over 2020-2026 is due to massive use of data visualization tools in the small & medium-scale companies in the U.S. In addition to this, rise in the need for data analytics in flourishing retail sector across countries like Canada & the U.S. will result in expansion of market size in the region over 2020-2026. Humungous need for information tracking from different sources and then representing this information through various kinds of charts in the form of data representation will drive the regional market trends.
The key market participants include Cluvio GmbH, Adaptive Insights, Alteryx, Inc., Domo, Inc., Highsoft AS, IBM Corporation, Microsoft Corporation, SAP SE, Tableau Software, LLC, Sisense, Inc., and ChartBlocks Ltd.
HappyClients
Zion Market Research
Tel: +1 (302) 444-0166
USA/Canada Toll Free No.+1 (855) 465-4651
3rd Floor,
Mrunal Paradise, Opp Maharaja Hotel,
Pimple Gurav, Pune 411061,
Maharashtra, India
Phone No +91 7768 006 007, +91 7768 006 008
US OFFICE NO +1 (302) 444-0166
US/CAN TOLL FREE +1 (855) 465-4651
Email: sales@zionmarketresearch.com
We have secured system to process your transaction.
Our support available to help you 24 hours a day, five days a week.
Monday - Friday: 9AM - 6PM
Saturday - Sunday: Closed


