Global Cleanroom Consumables Market Size, Share, Growth Analysis Report - Forecast 2034

Cleanroom Consumables Market By Product Type (Cleanroom Apparel (Gloves, Coveralls, Shoe Covers, Face Masks, Hoods), Cleaning Products (Mops, Buckets, Squeegees), Cleanroom Stationery (Notebooks, Labels), Cleaning Chemicals), By Application (Pharmaceuticals, Biotechnology, Electronics, Medical Devices, Food & Beverages, Aerospace & Defense), By End User (Hospitals & Clinics, Research Laboratories, Pharmaceutical Industry, Biotech Industry, Electronics Manufacturing), and By Region: Global and Regional Industry Overview, Market Intelligence, Comprehensive Analysis, Historical Data, and Forecasts 2025 - 2034
| Market Size in 2024 | Market Forecast in 2034 | CAGR (in %) | Base Year |
|---|---|---|---|
| USD 9.88 Billion | USD 19.08 Billion | 6.8% | 2024 |
Global Cleanroom Consumables Market: Industry Perspective
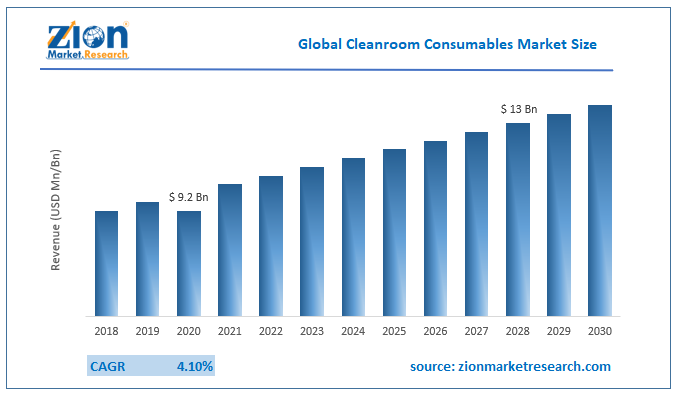
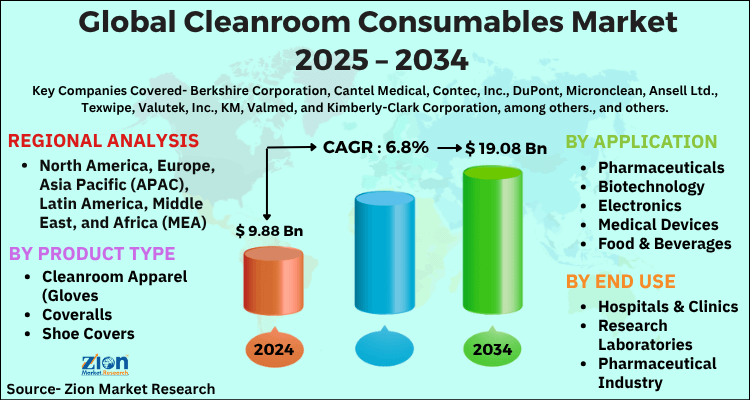
The global cleanroom consumables market size was worth around USD 9.88 Billion in 2024 and is predicted to grow to around USD 19.08 Billion by 2034 with a compound annual growth rate (CAGR) of roughly 6.8% between 2025 and 2034. The report analyzes the global cleanroom consumables market's drivers, restraints/challenges, and the effect they have on the demands during the projection period. In addition, the report explores emerging opportunities in the cleanroom consumables industry.
A cleanroom is considered to be the particular room or part that has a meticulous setting to offer a controlled surrounding or environment based on the level of contamination by microbes, dust, chemical vapours, airborne particles, and water vapor. Cleanrooms are mostly used to offer contamination-free surroundings in the product growth procedure. In the healthcare sector, cleanrooms find broad applications in hospitals, research laboratories, and pharmaceuticals.
Global Cleanroom Consumables Market: Overview
The cleanroom consumables market is experiencing steady growth, driven by expanding applications in industries like pharmaceuticals, biotechnology, electronics, and healthcare, where maintaining contamination-free environments is critical. Key consumables include gloves, wipes, face masks, garments, disinfectants, and adhesives, with demand fueled by stringent regulatory standards and the rising emphasis on product quality and safety. Technological advancements in materials offering superior filtration and comfort, along with increased manufacturing activities in emerging economies, are further propelling the market. However, high costs of specialized cleanroom products and waste disposal challenges pose some constraints. Overall, the market outlook remains positive, supported by growing investments in high-tech manufacturing and life sciences sectors.
Global Cleanroom Consumables Market: Growth Drivers
The growth of the cleanroom consumables market is primarily driven by the rising demand for contamination control in critical industries such as pharmaceuticals, biotechnology, semiconductors, and medical devices, where even minute impurities can compromise product quality and safety. Increasing regulatory requirements worldwide are pushing manufacturers to adopt stringent cleanliness standards, boosting the need for high-quality consumables like gloves, garments, wipes, and disinfectants. Additionally, rapid technological advancements in cleanroom materials, coupled with expanding manufacturing activities in emerging economies, are fueling market expansion. The surge in research and development in life sciences, particularly in response to global health challenges, further accelerates the demand for reliable cleanroom environments, making cleanroom consumables indispensable for operational efficiency and compliance.
Key Insights
- As per the analysis shared by our research analyst, the global cleanroom consumables market is estimated to grow annually at a CAGR of around 6.8% over the forecast period (2025-2034).
- Regarding revenue, the global cleanroom consumables market size was valued at around USD 9.88 Billion in 2024 and is projected to reach USD 19.08 Billion by 2034.
- The cleanroom consumables market is projected to grow at a significant rate due to expanding pharmaceutical and semiconductor industries, strict contamination control standards, and increased R&D activity.
- Based on Product Type, the Cleanroom Apparel (Gloves segment is expected to lead the global market.
- On the basis of Application, the Pharmaceuticals segment is growing at a high rate and will continue to dominate the global market.
- Based on the End User, the Hospitals & Clinics segment is projected to swipe the largest market share.
- Based on region, North America is predicted to dominate the global market during the forecast period.
Global Cleanroom Consumables Market: Report Scope
| Report Attributes | Report Details |
|---|---|
| Report Name | Cleanroom Consumables Market |
| Market Size in 2024 | USD 9.88 Billion |
| Market Forecast in 2034 | USD 19.08 Billion |
| Growth Rate | CAGR of 6.8% |
| Number of Pages | 185 |
| Key Companies Covered | Berkshire Corporation, Cantel Medical, Contec, Inc., DuPont, Micronclean, Ansell Ltd., Texwipe, Valutek, Inc., KM, Valmed, and Kimberly-Clark Corporation, among others., and others. |
| Segments Covered | By Product Type, By Application, By End User, and By Region |
| Regions Covered | North America, Europe, Asia Pacific (APAC), Latin America, The Middle East and Africa (MEA) |
| Base Year | 2024 |
| Historical Year | 2020 to 2023 |
| Forecast Year | 2025 - 2034 |
| Customization Scope | Avail customized purchase options to meet your exact research needs. Request For Customization |
Global Cleanroom Consumables Market: Segmentation Analysis
The global cleanroom consumables market is segmented based on Product Type, Application, End User, and region. All the segments have been analyzed based on present and future trends and the market is estimated from 2025 to 2034.
Based on Product Type, the global cleanroom consumables market is divided into Cleanroom Apparel (Gloves, Coveralls, Shoe Covers, Face Masks, Hoods), Cleaning Products (Mops, Buckets, Squeegees), Cleanroom Stationery (Notebooks, Labels), Cleaning Chemicals.
On the basis of Application, the global cleanroom consumables market is bifurcated into Pharmaceuticals, Biotechnology, Electronics, Medical Devices, Food & Beverages, Aerospace & Defense.
By End User, the global cleanroom consumables market is split into Hospitals & Clinics, Research Laboratories, Pharmaceutical Industry, Biotech Industry, Electronics Manufacturing.
The Regional, this segment includes the current and forecast demand for North America, Europe, Asia Pacific, Latin America,and the Middle East and Africa.
Global Cleanroom Consumables Market: Competitive Analysis
The report provides a company market share analysis to give a broader overview of the key market players. In addition, the report also covers key strategic developments of the market, including acquisitions & mergers, new product launches, agreements, partnerships, collaborations & joint ventures, research & development, and regional expansion of major participants involved in the cleanroom consumables market on a global and regional basis.
The global cleanroom consumables market is dominated by players like:
- Berkshire Corporation
- Cantel Medical
- Contec Inc.
- DuPont
- Micronclean
- Ansell Ltd.
- Texwipe
- Valutek Inc.
- KM
- Valmed
- and Kimberly-Clark Corporation
- Others
Global Cleanroom Consumables Market: Segmentation Segment Analysis
The global cleanroom consumables market is segmented as follows;
By Product Type
- Cleanroom Apparel (Gloves
- Coveralls
- Shoe Covers
- Face Masks
- Hoods)
- Cleaning Products (Mops
- Buckets
- Squeegees)
- Cleanroom Stationery (Notebooks
- Labels)
- Cleaning Chemica
By Application
- Pharmaceuticals
- Biotechnology
- Electronics
- Medical Devices
- Food & Beverages
- Aerospace & Defense
By End User
- Hospitals & Clinics
- Research Laboratories
- Pharmaceutical Industry
- Biotech Industry
- Electronics Manufacturing
Global Cleanroom Consumables Market: Regional Segment Analysis
- North America
- The U.S.
- Canada
- Mexico
- Europe
- France
- The UK
- Spain
- Germany
- Italy
- Rest of Europe
- Asia Pacific
- China
- Japan
- India
- Australia
- South Korea
- Rest of Asia Pacific
- The Middle East & Africa
- Saudi Arabia
- UAE
- Egypt
- Kuwait
- South Africa
- Rest of the Middle East & Africa
- Latin America
- Brazil
- Argentina
- Rest of Latin America
Table Of Content
Methodology
FrequentlyAsked Questions
The cleanroom consumables market is experiencing steady growth, driven by expanding applications in industries like pharmaceuticals, biotechnology, electronics, and healthcare, where maintaining contamination-free environments is critical. Key consumables include gloves, wipes, face masks, garments, disinfectants, and adhesives, with demand fueled by stringent regulatory standards and the rising emphasis on product quality and safety.
The global cleanroom consumables market is expected to grow due to expanding pharmaceutical and semiconductor industries, strict contamination control standards, and increased R&D activity.
According to a study, the global cleanroom consumables market size was worth around USD 9.88 Billion in 2024 and is expected to reach USD 19.08 Billion by 2034.
The global cleanroom consumables market is expected to grow at a CAGR of 6.8% during the forecast period.
North America is expected to dominate the cleanroom consumables market over the forecast period.
Leading players in the global cleanroom consumables market include Berkshire Corporation, Cantel Medical, Contec, Inc., DuPont, Micronclean, Ansell Ltd., Texwipe, Valutek, Inc., KM, Valmed, and Kimberly-Clark Corporation, among others., among others.
The report explores crucial aspects of the cleanroom consumables market, including a detailed discussion of existing growth factors and restraints, while also examining future growth opportunities and challenges that impact the market.
HappyClients

