Augmented Analytics Market Size, Share, Trends, and Companies Analysis 2032

Augmented Analytics Market By Service (Deployment and Integration, Training and Consulting and others), By Organization Size (SMEs and Large Enterprises): Global Industry Perspective, Comprehensive Analysis, and Forecast, 2024-2032
| Market Size in 2023 | Market Forecast in 2032 | CAGR (in %) | Base Year |
|---|---|---|---|
| USD 18.59 Billion | USD 171.46 Billion | 28% | 2023 |
Augmented Analytics Market Insights
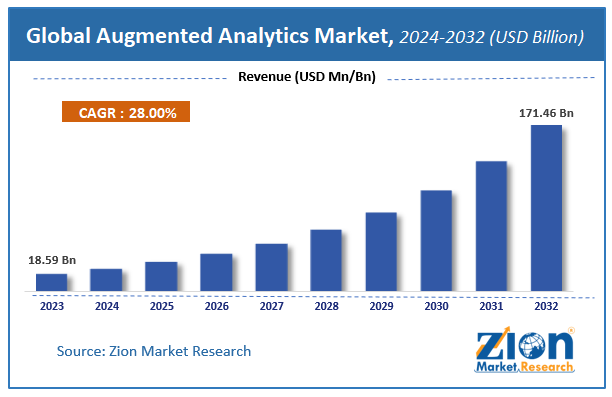
According to Zion Market Research, the global Augmented Analytics Market was worth USD 18.59 Billion in 2023. The market is forecast to reach USD 171.46 Billion by 2032, growing at a compound annual growth rate (CAGR) of 28% during the forecast period 2024-2032.
The report offers a comprehensive analysis of the market, highlighting the factors that will determine growth, potential challenges, and opportunities that could emerge in the Augmented Analytics Market industry over the next decade.
Market Overview
Augmented Analytics is a method of enabling technologies such as machine learning and artificial intelligence to assist with data preparation, insights extraction and insights explanation in order to augment how people explore data in BI platforms and analytics. It is based on business intelligence and analytics. The market is primarily driven by the increasing amount of complex business data in the organizations. Augmented analytics is especially useful in the today’s age where there is need of extraction of data, but there are not enough data scientists to do the task. The Augmented Analytics has many capabilities such as creation, analysis and building of data models. It greatly helps in data exploration and analysis.
Growth Factors
The increasing amount of complex business data across the organization has been the driving force of the Augmented analytics market. Due to the integration of artificial intelligence and machine learning technologies into analytics platforms, there is a growing demand in the software industry. The analytics market is also experiencing a transformation from traditional manual processes, while generating insights, into advanced AI, and ML-enabled bots.
Organizations have been on the increasing trend of building models and integrating data for simplifying and automating their tasks, and to do this augmented analytics has been an effective solution. The usage of augmented reality saves both time and resources that are needed to generate actionable insights out of the data. The SMEs have also been adapting augmented analytics solutions to a faster rate to enhance their operational productivity and maximize their profits. As augmented analytics helps SME’s to monitor growth of their businesses and generate ideal insights, there has been considerable demand for this market.
Service Analysis Preview
Augmented Analytics uses technologies such as Artificial Intelligence and Machine learning to get actionable insights from the data. Organizations use these insights to make informed decisions while operating their businesses. Thus, these insights prove extremely useful in consulting services where actionable insights have to be generated from complex data. Depending upon the insights obtained from the augmented analytics techniques, organizations train the workforce as required to maximize profits and increase overall organizational efficiency.
Organization Size Preview
This is due to the fact that there has been increasing demand for augmented analytics in the SMEs as they can use data, obtain specific insights and make it best use for driving innovation, business agility, developing new revenue streams and reducing operational risks. As it has been noticed that in this particular sector of industry, data collected is never revisited and is left unnoticed. So, there has been growing awareness to make the best use of this data using augmented analytics and drive organizational profits.
Regional Analysis Preview
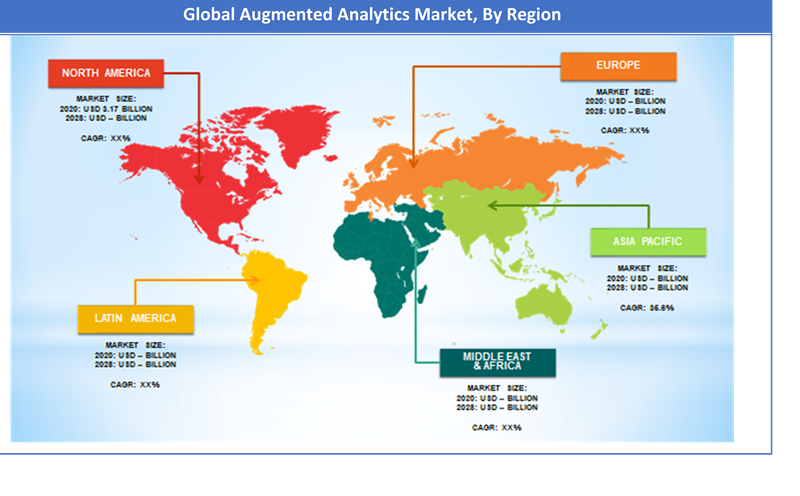
North America held a share of 34% in 2020. It is supposed to be one of the highest revenue-generating regions for this market during the forecasted period. This high growth is due to the factors such as technologically advanced infrastructure and the adoption of machine learning and artificial intelligence technologies on a large scale. Also, there have been significant advancements in the healthcare sector due to digitization. These upcoming tools like augmented analytics have been greatly helping the researchers and medical practitioners in this region to get connected in terms of data and actionable insights.
Asia-Pacific is expected to have a CAGR of 35.6 from 2021 to 2028. This is due to the fact that organizations have begun shifting from conventional enterprise reporting to augmented analytics tools in order to boost data preparation and cleansing. Companies have been readily investing in training the workforce for augmented analytics and thus there is considerable demand for this market is high in the Asia-Pacific region.
Augmented Analytics Market: Report Scope
| Report Attributes | Report Details |
|---|---|
| Report Name | Augmented Analytics Market |
| Market Size in 2023 | USD 18.59 Billion |
| Market Forecast in 2032 | USD 171.46 Billion |
| Growth Rate | CAGR of 28% |
| Number of Pages | 140 |
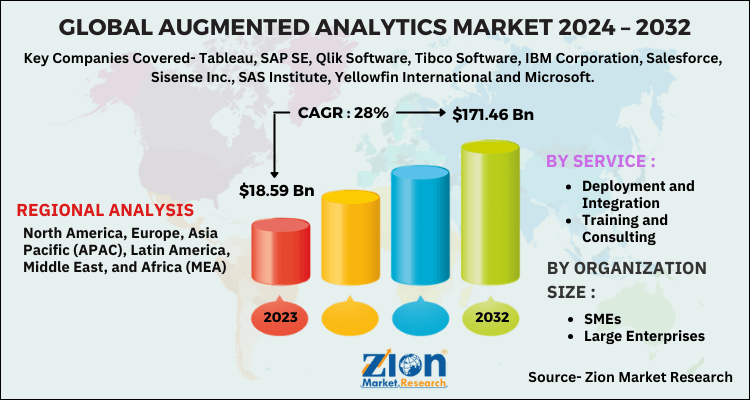
| Key Companies Covered | Tableau, SAP SE, Qlik Software, Tibco Software, IBM Corporation, Salesforce, Sisense Inc., SAS Institute, Yellowfin International and Microsoft. |
| Segments Covered | By Service, By Organization Size, and By Region |
| Regions Covered | North America, Europe, Asia Pacific (APAC), Latin America, Middle East, and Africa (MEA) |
| Base Year | 2023 |
| Historical Year | 2018 to 2022 |
| Forecast Year | 2024 - 2032 |
| Customization Scope | Avail customized purchase options to meet your exact research needs. Request For Customization |
Key Market Players & Competitive Landscape
Some of the key players in the Augmented Analytics market include
- Tableau
- SAP SE
- Qlik Software
- Tibco Software
- IBM Corporation
- Salesforce
- Sisense Inc.
- SAS Institute
- Yellowfin International and Microsoft.
In April 2021, Subex launched HyperSense, which is an end-to-end augmented analytics platform. This is a flexible, modular and no-code solution built to accelerate the adoption of Artificial Intelligence in enterprise analytics. HyperSense involves data management studio, business modelling studio, AI studio, Business Intelligence studio and process automation studio.
The Global Augmented Analytics Market is segmented as follows:
By Service
- Deployment and Integration
- Training and Consulting
By Organization Size
- SMEs
- Large Enterprises
By Region
- North America
- The U.S.
- Canada
- Europe
- France
- The UK
- Spain
- Germany
- Italy
- Rest of Europe
- Asia Pacific
- China
- Japan
- India
- South Korea
- Southeast Asia
- Rest of Asia Pacific
- Latin America
- Brazil
- Mexico
- Rest of Latin America
- Middle East & Africa
- GCC
- South Africa
- Rest of Middle East & Africa
Table Of Content
Methodology
FrequentlyAsked Questions
Augmented Analytics Market size is set to expand from $ 18.59 Billion in 2023
Augmented Analytics Market size is set to expand from $ 18.59 Billion in 2023 to $ 171.46 Billion by 2032, with an anticipated CAGR of around 28% from 2024 to 2032.
Some of the key factors driving the Global Augmented Analytics Market growth are the increasing amount of complex business data across the organization and the integration of artificial intelligence and machine learning technologies into analytics platforms. The analytics market is also experiencing transformation from traditional manual processes, while generating insights, into advanced AI, and ML enabled bots. Organizations have been on the increasing trend of building models and integrating data for simplifying and automating their tasks, and to do this augmented analytics has been the effective solution.
North America held a share of 34% in 2020. It is supposed to be one of the highest revenue-generating regions for this market during the forecasted period. This high growth is due to the factors such as technologically advanced infrastructure and adoption of machine learning and artificial intelligence technologies on large scale. Also, there have been significant advancements in the healthcare sector due to digitization. These upcoming tools like augmented analytics have been greatly helping the researchers and medical practitioners in this region in get connected in terms of data and actionable insights.
Some of the key players in the Augmented Analytics market include Tableau, SAP SE, Qlik Software, Tibco Software, IBM Corporation, Salesforce, Sisense Inc., SAS Institute, Yellowfin International and Microsoft among others.
HappyClients

