Access Control Market Size, Share, Global Trends Report, 2032

Access Control Market By Technology (Hardware, Software and Services), By Access Control as a Service (Hosted ACaaS, Managed ACaaS and Hybrid ACaaS), By Vertical (Commercial, Military and Defense, Government, Residential, Education, Healthcare, Manufacturing and Industrial and Transportation), and By Region: Global Industry Perspective, Comprehensive Analysis and Forecast, 2024 - 2032
| Market Size in 2023 | Market Forecast in 2032 | CAGR (in %) | Base Year |
|---|---|---|---|
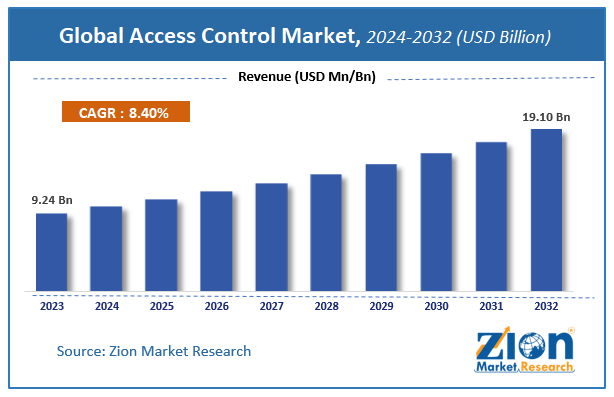
| USD 9.24 Billion | USD 19.10 Billion | 8.4% | 2023 |
Access Control Market Insights
Zion Market Research has published a report on the global Access Control Market, estimating its value at USD 9.24 Billion in 2023, with projections indicating that it will reach USD 19.10 Billion by 2032. The market is expected to expand at a compound annual growth rate (CAGR) of 8.4% over 2024-2032.
The report explores the factors fueling market growth, the hitches that could hamper this expansion, and the opportunities that may arise in the Access Control Market industry. Additionally, it offers a detailed analysis of how these elements will affect market demand dynamics and market performance throughout the forecast period.
Global Access Control Market Overview
Access control is a technique that regulates who can use or view resources in a computing environment. It is an essential concept in security which minimizes risk to the organization or business. Access control can be of two types logical and physical. Logical access control restricts connections to system files, computer networks and data. Physical access limits access to buildings, campuses, physical IT assets and rooms.
Logical access control systems are used to secure the facility, businesses and institutes use access control systems that rely on user access card readers, credentials and reports to grant access or restrict employee access to certain business locations such as data centers. Some of these control systems restrict entry to buildings and rooms, along with alarms and lockdown capability access control systems, to avoid unauthorized operations or access. All these features related to security protocol are anticipated to propel market growth in the long run. In July 2018, Bitglass, one of the leading Cloud Access Security Brokers, partnered with Okta, an identity provider, to bring real-time data security and threat protection for the companies moving from to cloud.
COVID-19 Impact Analysis
COVID-19 struck the access control market and negatively impacted the sales of access control systems. The pandemic resulted in the most challenging operation situation in history; it also impacted the financial performance of the companies along with the operating income and profitability.
The companies relied on internal recruitment rather than external hiring to cut down recruitment costs and increase their collaboration through numerous digital platforms, which is expected to improve productivity post-COVID-19. To battle the ill effects of COVID-19, the companies focused on improving employee safety, energy, water and materials efficiency along with certain other measures to reduce wastage and increase productivity.
Access Control Market: Growth Factors
The access control market is expected to grow exponentially in the forecast period. The rising use of access control systems for security purposes for employers & employees, as it protects employees from incidents that might happen in office premises or other places. The application of access control systems contributes to the growth of the safety and security of office premises. The surging penetration of smart home solutions is driving the need for home automation and connected access control systems which can be operated remotely, eventually propelling the market growth.
The rising security concerns related to data safety, coupled with the surging adoption of electronic devices & wireless technology are some of the factors driving market growth in the projected timeframe. Additionally, due to technological advancement and the arrival of the Internet of Things for cloud computing, Blockchain and connected devices technology are also contributing to the market's growth. Governments in numerous countries have been deploying biometric readers for various purposes, including law enforcement, public identity, and employee identification.
Access Control Market: Report Scope
| Report Attributes | Report Details |
|---|---|
| Report Name | Access Control Market |
| Market Size in 2023 | USD 9.24 Billion |
| Market Forecast in 2032 | USD 19.10 Billion |
| Growth Rate | CAGR of 8.4% |
| Number of Pages | 210 |
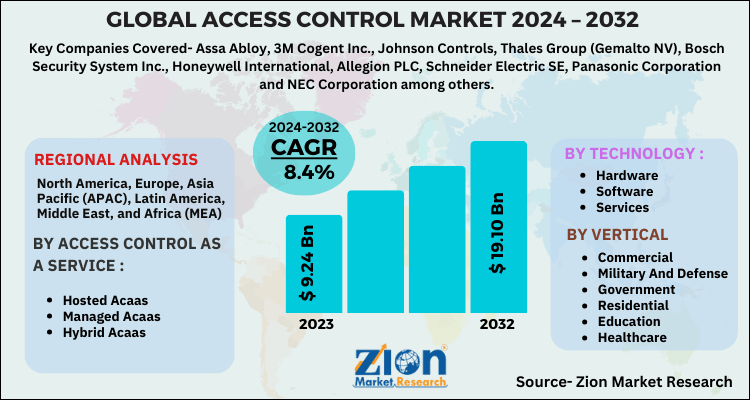
| Key Companies Covered | Assa Abloy, 3M Cogent Inc., Johnson Controls, Thales Group (Gemalto NV), Bosch Security System Inc., Honeywell International, Allegion PLC, Schneider Electric SE, Panasonic Corporation and NEC Corporation among others. |
| Segments Covered | By Technology, By Access Control as a Service, By Vertical and By Region |
| Regions Covered | North America, Europe, Asia Pacific (APAC), Latin America, Middle East, and Africa (MEA) |
| Base Year | 2023 |
| Historical Year | 2018 to 2022 |
| Forecast Year | 2024 - 2032 |
| Customization Scope | Avail customized purchase options to meet your exact research needs. Request For Customization |
Access Control Market: Segmentation Analysis
Biometric readers under the hardware segment held a share of above 23% in 2023. This is due to the use of biometric technologies for measuring many physiological parameters for authentication and identification purposes in access control systems. It is considered to be one of the fastest-growing technologies used for securing perimeters. It is being increasingly used in manufacturing units, government facilities, defense establishments, enterprises and power stations.
Biometrics technologies are commonly deployed systems in a variety of industries, including financial services, healthcare, hospitality and travel. All this is anticipated to support market growth in the long run. Other segments under hardware are card-based readers, multi-technology readers, electronic locks, controllers and others.
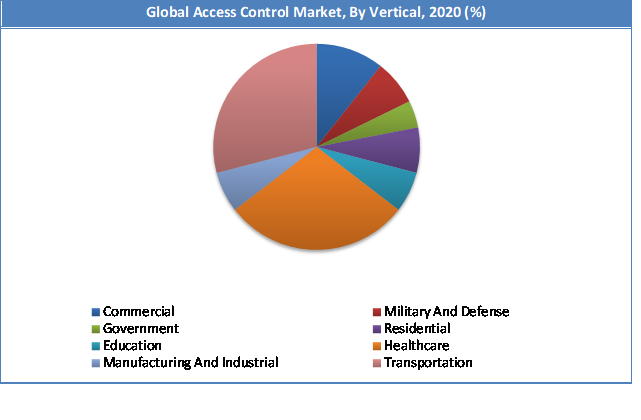
In the Global Access Control Market Report, Commercials under the vertical segment will grow at a CAGR of over 7.2% between 2023 to 2032. The surge is due to the rising adoption of access control systems by facilities and units such as data centers and enterprises, BFSI, malls, retail stores entertainment and fun activity areas. Manned securities are expensive and difficult for all physical locations.
Access control systems demand is increasing in commercial facilities as it has reduced the need for manned security in many places. These factors are anticipated to positively impact the market growth and increase the adoption of access control systems to protect lives and property.
Global Access Control Market: Regional Analysis
In the Global Access Control Market Report, North America held a share above 37.83% in the access control market in 2023. This is due to the surging malware and cyber-attacks in the region. Numerous security agencies and governments are forced to enrich security features in their transactions via biometric and RFID technologies.
Additionally, companies in Canada, US and Mexico are making efforts to develop innovative access control systems and solutions. This will give them an advantage over their competitors thereby, increasing their share of the access control market in the region. All this will contribute to the overall growth of the access control market in the long run.
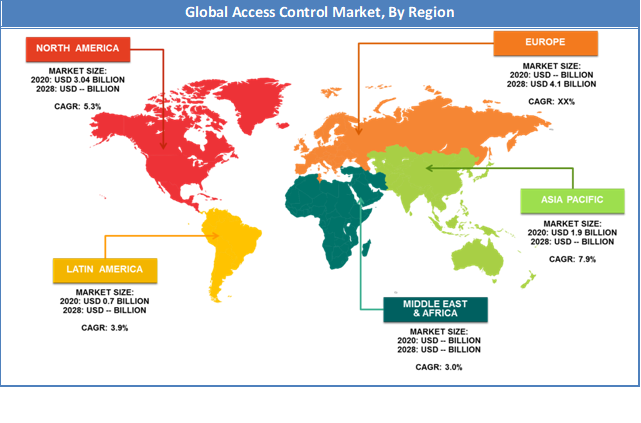
Asia Pacific is expected to grow at a CAGR of over 8.9% in 2024-2032. The surge is due to the advancements in the security system by the players in the region. Additionally, rising demand for access control systems in residential properties to avert burglary and invasion. The surging adoption of electronic lock access systems for residential properties is expected to drive market growth.
Furthermore, the rising importance of home automation and smart homes are some other factors driving the market growth. The other factors contributing to the market growth are surging crime rates, current technological advancements, and the rising need to identify gas leaks or fire outbreaks along with the safety of children in resident premises.
Access Control Market: Competitive Analysis
Some of the major players in the global Access Control market include:
- Assa Abloy
- 3M Cogent Inc.
- Johnson Controls
- Thales Group (Gemalto NV)
- Bosch Security System Inc.
- Honeywell International
- Allegion PLC
- Schneider Electric SE
- Panasonic Corporation
- NEC Corporation
The Global access control market is segmented as follows:
By Technology
- Hardware
- Card-Based Readers
- Biometric Readers
- Multi-Technology Readers
- Electronic Locks
- Controllers
- Others
- Software
- Visitor Management System
- Others
- Services
- Installation and Integration
- Support and Maintenance
By Access Control as a Service
- Hosted Acaas
- Managed Acaas
- Hybrid Acaas
By Vertical
- Commercial
- Military And Defense
- Government
- Residential
- Education
- Healthcare
- Manufacturing And Industrial
- Transportation
By Region
- North America
- The U.S.
- Canada
- Europe
- France
- The UK
- Spain
- Germany
- Italy
- Rest of Europe
- Asia Pacific
- China
- Japan
- India
- South Korea
- Southeast Asia
- Rest of Asia Pacific
- Latin America
- Brazil
- Mexico
- Rest of Latin America
- Middle East & Africa
- GCC
- South Africa
- Rest of Middle East & Africa
Table Of Content
Methodology
FrequentlyAsked Questions
According to a study, the Global Access Control market size was worth around USD 9.24 billion in 2023 and is expected to reach USD 19.10 billion by 2032.
The Global Access Control market is expected to grow at a CAGR of 8.4% during the forecast period.
Some of the key factors driving the Global access control market are rising use of access control systems for security purposes for employers & employees, as it protects employees from incidents which might happen in office premises or other places. The application of access control systems contributes in the growth for safety and security of office premise. The surging penetration of smart home solutions is driving the need for home automation and connected access control systems which can be operated remotely, eventually propelling market growth.
Asia Pacific is expected to dominate the Access Control market over the forecast period.
Some of the key players of access control market are Assa Abloy, 3M Cogent Inc., Johnson Controls, Thales Group (Gemalto NV), Bosch Security System Inc., Honeywell International, Allegion PLC, Schneider Electric SE, Panasonic Corporation and NEC Corporation among others.
HappyClients

