Graph Analytics Market Size, Share, Trends, Industry Analysis & Growth 2032

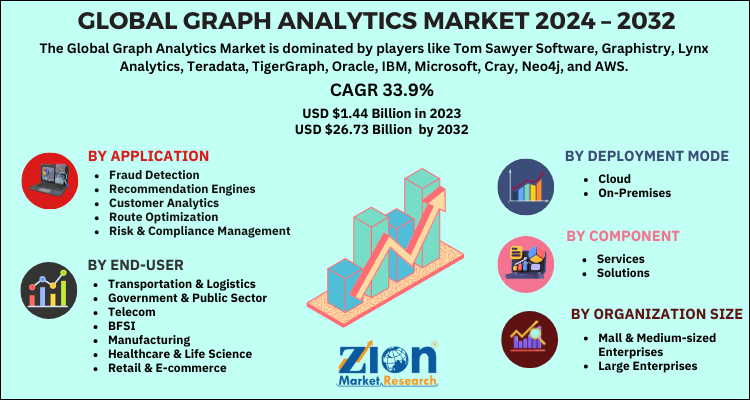
Graph Analytics Market By deployment mode (cloud and on-premises), By component (services and solutions), By application (fraud detection, recommendation engines, customer analytics, route optimization, risk & compliance management, and others), By organization size (mall & medium-sized enterprises and large enterprises), By end-user (transportation & logistics, government & public sector, telecom, BFSI, manufacturing, healthcare & life science, retail & e-commerce, and others) And By Region: - Global And Regional Industry Overview, Market Intelligence, Comprehensive Analysis, Historical Data, And Forecasts, 2024-2032
| Market Size in 2023 | Market Forecast in 2032 | CAGR (in %) | Base Year |
|---|---|---|---|
| USD 1.44 Billion | USD 26.73 Billion | 33.9% | 2023 |
Description
What is the Graph Analytics Market Size?
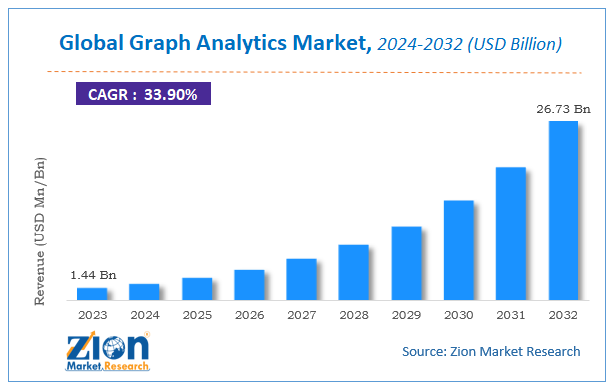
According to the report published by Zion Market Research, the global Graph Analytics Market size was valued at USD 1.44 Billion in 2023 and is predicted to reach USD 26.73 Billion by the end of 2032. The market is expected to grow with a CAGR of 33.9% during the forecast period. The report analyzes the global Graph Analytics Market's growth drivers, restraints, and impact on demand during the forecast period. It will also help navigate and explore the arising opportunities in the Graph Analytics industry.
 Request Free SampleRequest Free Sample
Global Graph Analytics Market: Overview
Graph analytics, also termed network analysis is an analytics alternative that uses abstraction which is known as graph model. This model enables to rapidly absorb and connect large volumes of data from several sources. It is an alternative to the traditional data warehouse model as a framework to absorb both unstructured & structured data from numerous sources to allow the analyst to examine the data.
Global Graph Analytics Market: Growth Factors
The rise in need for the analysis of data in real-time, the increase in integration of IoT & artificial intelligence-based technologies, and the growing need for identification of complex patterns are some of the key factors that are majorly boosting the growth of the global graph analytics market. Graph analytics takes less time in data organization and thus saves a lot of time. It also enables the retrieval, modeling, and storage of the data it analyzes. Graph analytics is been widely used in numerous areas. It helps to identify fraudulent or illegal behavior as well as a criminal activity such as cybercrimes, money laundering, and many more.
This enables to strengthen institutional or enterprise security. In healthcare & pharmaceuticals, graph analytics plays a vital role. It can discover effective and novel ways of treatment by evaluating relationships in chemical pathways, proteins, organs, cells, and DNA. Graph analytics can also determine the influence of a combination of medication & lifestyle choices on them. Thus, due to its wide applications in several industries including healthcare, BFSI, transportation & logistics, and many more, there is a surge in the demand for graph analytics. This is spurring the growth of the global market. Moreover, the rise in demand for the analysis of low latency queries, the increase in the need to analyze business problems, and the rise in application of graph analytics in digital marketing are also some of the key aspects that are contributing to the growth of the market.
Furthermore, the rapid adoption of graph analytics for the virtualization of big data analytics is likely to offer great opportunities for the growth of the global graph analytics market during the forecast period. However, the dearth of skilled professionals may restrain the growth of the global graph analytics market.
The outbreak of Covid-19 has affected the global economy. The complete lockdown and restriction on movement have forced the industries to close down their developmental, operational, and commercial units. This affected the demand for graph analytics from BFSI, manufacturing, and the public sector. The media & entertainment and transportation sector has also been severely hit by the Covid-19 pandemic. These factors affected the growth of the global graph analytics market. On the other hand, with ease in restriction and permission for transportation, the industrial sector is likely to come on track which in turn will contribute to a healthy growth rate for the market.
 Request Free SampleRequest Free Sample
Global Graph Analytics Market: Segmentation
The global graph analytics market is segregated based on deployment mode, component, application, organization size, end-user, and region.
Based on the deployment mode, the global graph analytics market is categorized into cloud and on-premises.
Based on the component, the global market is split into services and solutions.
The application segment is bifurcated into fraud detection, recommendation engines, customer analytics, route optimization, risk & compliance management, and others.
Based on the organization size, the market is divided into small & medium-sized enterprises and large enterprises.
The end-user segment is classified into transportation & logistics, government & public sector, telecom, BFSI, manufacturing, healthcare & life science, retail & e-commerce, and others.
Graph Analytics Market: Report Scope
| Report Attributes | Report Details |
|---|---|
| Report Name | Graph Analytics Market |
| Market Size in 2023 | USD 1.44 Billion |
| Market Forecast in 2032 | USD 26.73 Billion |
| Growth Rate | CAGR of 33.9% |
| Number of Pages | 197 |
| Key Companies Covered | Tom Sawyer Software, Graphistry, Lynx Analytics, Teradata, TigerGraph, Oracle, IBM, Microsoft, Cray, Neo4j, and AWS |
| Segments Covered | By Deployment Mode, By Component, By Application, By Organization Size, By End-User And By Region |
| Regions Covered | North America, Europe, Asia Pacific (APAC), Latin America, Middle East, and Africa (MEA) |
| Base Year | 2023 |
| Historical Year | 2018 to 2022 |
| Forecast Year | 2024 - 2032 |
| Customization Scope | Avail customized purchase options to meet your exact research needs. Request For Customization |
Global Graph Analytics Market: Regional Analysis
North America is anticipated to lead the global graph analytics market. Factors such as the rise in adoption of graph analytics from the banking & healthcare sector, presence of major players and growing integration of AI & IoT-based technologies are fueling the growth of the market in this region. Europe is the second-largest market and is estimated to account for a significant share in the market. On the other hand, Asia Pacific is expected to grow at a fast rate due to the growing demand for graph analytics by small & mid-sized enterprises and the growing need for fraud detection.
Global Graph Analytics Market: Competitive Players
Some of the key players operating in the global graph analytics market are:
- Tom Sawyer Software
- Graphistry
- Lynx Analytics
- Teradata
- TigerGraph
- Oracle
- IBM
- Microsoft
- Cray
- Neo4j
- AWS.
The Global Graph Analytics Market is segmented as follows:
By deployment mode
- cloud
- on-premises
By component
- services
- solutions
By application
- fraud detection
- recommendation engines
- customer analytics
- route optimization
- risk & compliance management
- and others
By organization size
- mall & medium-sized enterprises
- large enterprises
By end-user
- transportation & logistics
- government & public sector
- telecom
- BFSI
- manufacturing
- healthcare & life science
- retail & e-commerce
- and others
By Region
- North America
- The U.S.
- Canada
- Mexico
- Europe
- France
- The UK
- Spain
- Germany
- Italy
- Rest of Europe
- Asia Pacific
- China
- Japan
- India
- Australia
- South Korea
- Rest of Asia Pacific
- The Middle East & Africa
- Saudi Arabia
- UAE
- Egypt
- Kuwait
- South Africa
- Rest of the Middle East & Africa
- Latin America
- Brazil
- Argentina
- Rest of Latin America
What Reports Provides
- Full in-depth analysis of the parent market
- Important changes in market dynamics
- Segmentation details of the market
- Former, on-going, and projected market analysis in terms of volume and value
- Assessment of niche industry developments
- Market share analysis
- Key strategies of major players
- Emerging segments and regional markets
- Testimonials to companies in order to fortify their foothold in the market.
Table Of Content
FrequentlyAsked Questions
Graph analytics is the process of analyzing data structured as networks of nodes and relationships. It helps uncover patterns, connections, and insights in complex datasets.
The global Graph Analytics market is expected to be driven by the Driven by increasing adoption of big data analytics, fraud detection, and network analysis applications. Growing use across BFSI, telecom, and cybersecurity sectors accelerates market growth.
According to study, the global Graph Analytics market size was worth around USD 1.44 Billion in 2023 and is predicted to grow to around USD 26.73 Billion By 2032.
The global Graph Analytics market is expected to grow at a Compound Annual Growth Rate (CAGR) of around CAGR 33.9% during the forecast period from 2024-2032.
The global Graph Analytics industry is projected to be challenged by Data integration complexity; high implementation costs; lack of skilled data scientists.
The Growing adoption of AI and big data analytics; use in fraud detection and cybersecurity; rising demand from BFSI and telecom will offer significant growth opportunities in the Graph Analytics market.
Graph + AI fusion for fraud, cybersecurity, and recommendation engines; real-time graph processing and streaming ingestion; wider use of knowledge graphs for enterprise search and LLM grounding are the emerging trends and innovations impacting the Graph Analytics market.
The global Graph Analytics market is expected to be led by North America during the forecast period.
Some of the prominent players operating in the global Graph Analytics market are; Tom Sawyer Software, Graphistry, Lynx Analytics, Teradata, TigerGraph, Oracle, IBM, Microsoft, Cray, Neo4j, and AWS and others.
The report explores crucial aspects of the Graph Analytics market, including a detailed discussion of existing growth factors and restraints, while also browsing future growth opportunities and challenges that impact the market.
HappyClients

